Annotate your code
You can add traces for multiple, specific functions in your code to your logs by annotating them with functional wrappers (TypeScript) or decorators and context managers (Python):Add names to traces
You can add custom names to traces using thename parameter. If you don’t provide a name, the SDK will use the function name or “anonymous” if the function is unnamed.
Wrap LLM clients
Wrap OpenAI
For information about how to wrap OpenAI clients, check out the OpenAI provider docs.Wrap Anthropic
For information about how to wrap Anthropic clients, check out the Anthropic provider docs.Wrap Gemini
For information about how to wrap Google Gemini clients, check out the Gemini provider docs.Wrap a custom LLM client
If you’re using your own client, you can wrap it yourself using the same conventions as the OpenAI wrapper. Check out the Python and TypeScript implementations for reference. To track the span as an LLM, include the following in your wrapper:- Specify the
typeasllm. You can specify anynameyou’d like. This enables LLM duration metrics. - Add
prompt_tokens,completion_tokens, andtokensto themetricsfield. This enables LLM token usage metrics. - To track cached tokens, log
prompt_cached_tokens(cache reads) andprompt_cache_creation_tokens(cache writes) tometrics. By convention,prompt_tokensshould include bothprompt_cached_tokensandprompt_cache_creation_tokens. So if you have a request with 10 cache read tokens, 5 cache write tokens, and 3 uncached tokens, you should logprompt_tokens: 18. - Format the
inputas a list of messages (using the OpenAI format), and put other parameters (likemodel) inmetadata. This enables the Try prompt button in the UI.
Trace distributed systems
When traces span multiple services or processes, you can export and resume traces across boundaries using theexport() method.
Trace multimodal content
Braintrust supports uploading file attachments like images, audio, video, and PDFs alongside your traces. This is especially useful for multimodal models and visual evaluations. For large JSON data structures, useJSONAttachment to bypass size limits.
See the Attachments guide for detailed examples on:
- Uploading files (images, audio, video, PDFs)
- Logging large JSON data (conversation transcripts, document collections)
- Linking external files (S3 and other object stores)
- Inline attachments (external URLs and base64 images)
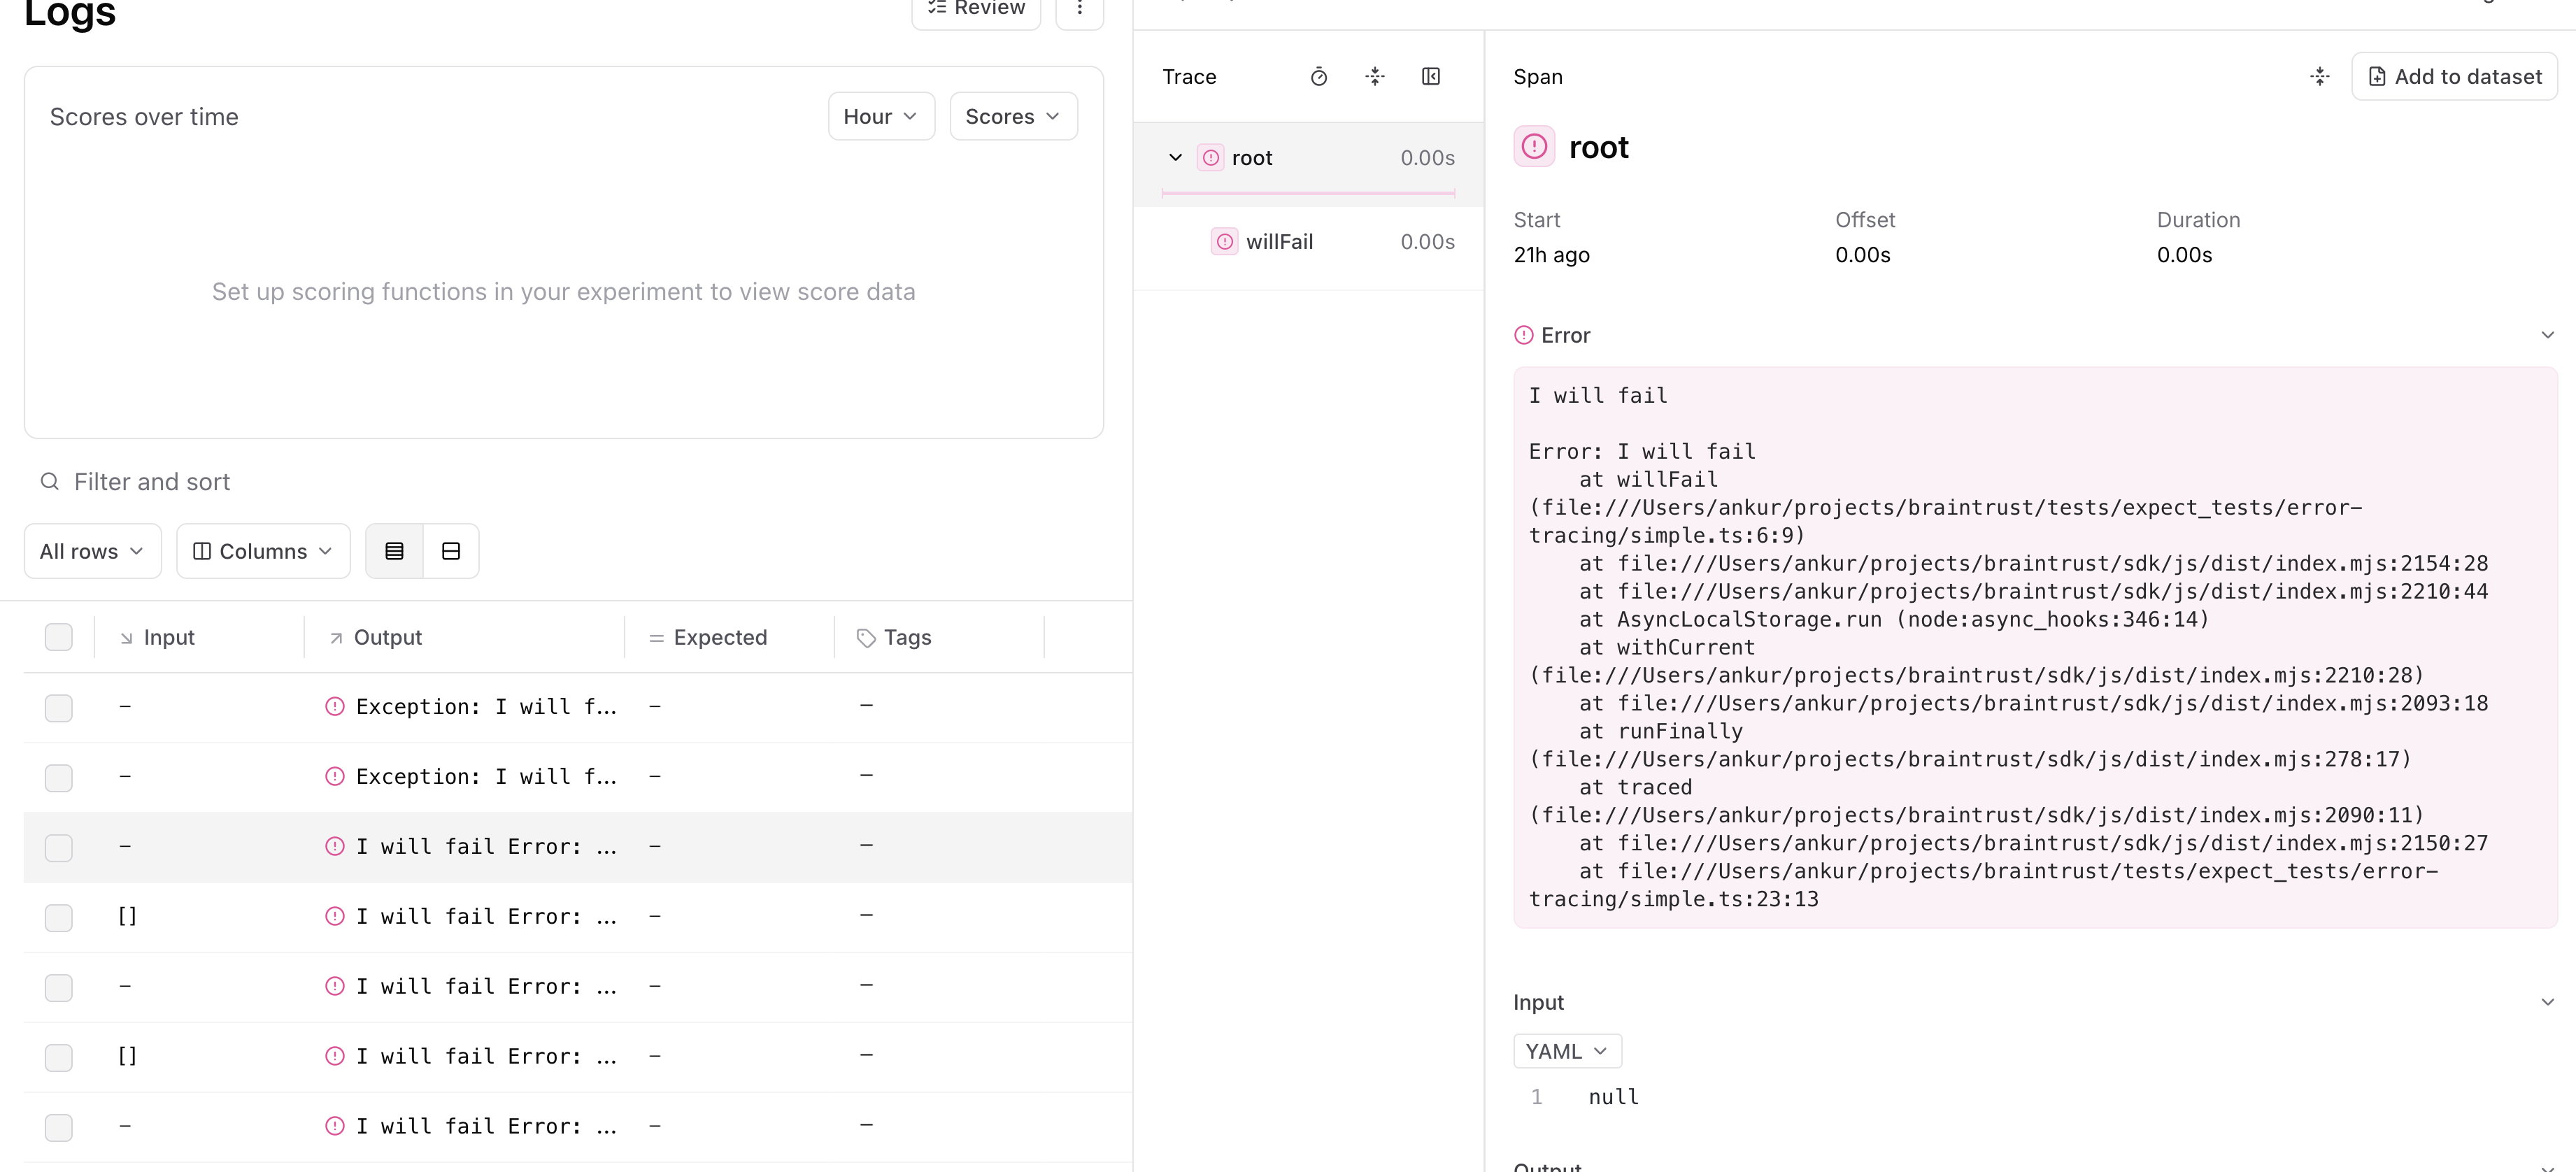
Trace errors
When you run:- Python code inside of the
@traceddecorator or within astart_span()context - TypeScript code inside of
traced(or awrappedTracedfunction)

error field which you can also log to directly.
Trace deeply nested code
Often, you want to trace functions that are deep in the call stack, without having to propagate thespan object throughout. Braintrust uses async-friendly
context variables to make this workflow easy:
- The
tracedfunction/decorator will create a span underneath the currently-active span. - The
currentSpan()/current_span()method returns the currently active span, in case you need to do additional logging.
Mask sensitive data
Configure a global masking function to redact sensitive information before it’s sent to Braintrust. The masking applies toinput, output, expected, metadata, and context fields.
Mask personally identifiable information (PII)
This example demonstrates masking PII such as email addresses, phone numbers, and social security numbers:Enable custom masking for specific data structures
This example shows how to handle custom data structures and implement selective masking based on context:Considerations
- The masking function is applied globally and affects all logging across your application
- Masking is applied after events are merged but before they are sent to Braintrust
- The masking function can modify data in place, which is often more performant
- Only the fields
input,output,expected,metadata, andcontextare passed to the masking function - Always test your masking function thoroughly to ensure sensitive data is properly redacted
- In the event of an error, the data will be masked with a generic message like
ERROR: Failed to mask fieldto avoid leaking sensitive information
Update spans
Similar to distributed tracing, it can be useful to update spans after you initially log them. For example, if you collect the output of a span asynchronously. TheExperiment and Logger classes each have an updateSpan() method, which you can call with
the span’s id to perform an update.
span.export() to export the span in a fully contained string, which is useful if you
have multiple loggers or perform the update from a different service.
Deep link to spans
TheSpan.permalink method formats a permalink to the Braintrust application
for viewing the span. The link will open the UI to the row represented by the
Span object.
If you do not have access to the original Span object, the slug produced by
Span.export contains enough information to produce the same permalink. The
braintrust.permalink function can be used to construct a deep link to the row
in the UI from a given span slug.
Manually manage spans
In more complicated environments, it may not always be possible to wrap the entire duration of a span within a single block of code. In such cases, you can always pass spans around manually. Consider this hypothetical server handler, which logs to a span incrementally over several distinct callbacks:Import and export spans
Spans are processed in Braintrust as a simple format, consisting ofinput, output, expected, metadata, scores,
and metrics fields (all optional), as well as a few system-defined fields which you usually do not need to mess with, but
are described below for completeness. This simple format makes
it easy to import spans captured in other systems (e.g. languages other than TypeScript/Python), or to export spans from
Braintrust to consume in other systems.
Underlying format
The underlying span format contains a number of fields which are not exposed directly through the SDK, but are useful to understand when importing and exporting spans.idis a unique identifier for the span, within the container (e.g. an experiment, or logs for a project). You can technically set this field yourself (to overwrite a span), but it is recommended to let Braintrust generate it automatically.input,output,expected,scores,metadata, andmetricsare optional fields which describe the span and are exposed in the Braintrust UI. When you use the TypeScript or Python SDK, these fields are validated for you (e.g. scores must be a mapping from strings to numbers between 0 and 1).span_attributescontains attributes about the span. Currently the recognized attributes arename, which is used to display the span name in the UI, andtype, which displays a helpful icon.typeshould be one of"llm","score","function","eval","task","tool", or"review".- Depending on the container, e.g. an experiment, or project logs, or a dataset, fields like
project_id,experiment_id,dataset_id, andlog_idare set automatically, by the SDK, so the span can be later retrieved by the UI and API. You should not set these fields yourself. span_id,root_span_id, andspan_parentsare used to construct the span tree and are automatically set by Braintrust. You should not set these fields yourself, but rather let the SDK create and manage them (even if importing from another system).
input, output, expected, scores, metadata, and metrics.
You can use the SDK to populate the remaining fields, which the next section covers with an example.
Here is an example of a span in the underlying format:
Example import/export
The following example walks through how to generate spans in one program and then import them to Braintrust in a script. You can use this pattern to support tracing or running experiments in environments that use programming languages other than TypeScript/Python (e.g. Kotlin, Java, Go, Ruby, Rust, C++), or codebases that cannot integrate the Braintrust SDK directly.Generate spans
The following example runs a simple LLM app and collects logging information at each stage of the process, without using the Braintrust SDK. This could be implemented in any programming language, and you certainly do not need to collect or process information this way. All that matters is that your program generates a useful format that you can later parse and use to import the spans using the SDK.Import spans
The following program uses the Braintrust SDK in Python to import the spans generated by the previous script. Again, you can modify this program to fit the needs of your environment, e.g. to import spans from a different source or format.Run traced functions in a ThreadPoolExecutor
The Python SDK uses context variables to hold the span state for traces. This means that if you run a traced function inside of aconcurrent.futures.ThreadPoolExecutor,
the span state will be lost.
Instead, you can use the TracedThreadPoolExecutor class provided by the Braintrust SDK.
This class is a thin extension of concurrent.futures.ThreadPoolExecutor
that captures and passes context variables to its workers.
Disable logging
If you are not running an eval or logging, then the tracing code will be a no-op with negligible performance overhead. In other words, if you do not call initLogger/init_logger/init, in your code, then the tracing annotations are a no-op.Trace data structures
A trace is a directed acyclic graph (DAG) of spans. Each span can have multiple parents, but most executions are a tree of spans. Currently, the UI only supports displaying a single root span, due to the popularity of this pattern.Background logging and retries
If the Braintrust SDK cannot log for some reason (e.g. a network issue), then your application should not be affected. All logging operations run in a background thread, including api key validation, project/experiment registration, and flushing logs. When errors occur, the SDK retries a few times before eventually giving up. You’ll see loud warning messages when this occurs. And you can tune this behavior via the environment variables defined in Tune performance.Log to multiple projects
When logging to multiple projects, create separate loggers withsetCurrent: false to avoid conflicts.
Initialize login
The logger lazily authorizes against Braintrust when it is first used. This information is shared across loggers, but you may want to explicitly calllogin() once to avoid having to pass in an API key to each logger (or to use the BRAINTRUST_API_KEY environment variable).
There is a lower-level mechanism which can even let you use different API keys for different loggers, but it’s not documented or officially supported. Get in touch if you need this.
Flush logs manually
The SDK buffers logs in memory and sends them in batches to improve performance. WhenasyncFlush / async_flush is enabled (the default), you can use the .flush() method to manually flush any outstanding logs to the server.
This is useful in cleanup functions or when you need to ensure all logs are sent before the program exits.
atexit flush hook by default. If your runtime manages shutdown explicitly, set BRAINTRUST_DISABLE_ATEXIT_FLUSH=1 and call logger.flush() yourself during cleanup. This is useful in serverless and long-running service environments where you want explicit control over shutdown behavior.
Customize span rendering
Although the built-in span viewers cover a variety of different span field display types—YAML, JSON, Markdown, LLM calls, and more—you may
want to further customize the display of your span data. For example, you could include the id of an internal database
and want to fetch and display its contents in the span viewer. Or, you may want to reformat the data in the span in a way
that’s more useful for your use case than the built-in options.
Span iframes provide complete control over how you visualize span data, making them particularly valuable for when you have custom visualization needs or want to incorporate data from external sources. They also support interactive features - for example, you can implement custom human review feedback mechanisms like thumbs up/down buttons on image search results and write the scores directly to the expected or metadata fields.
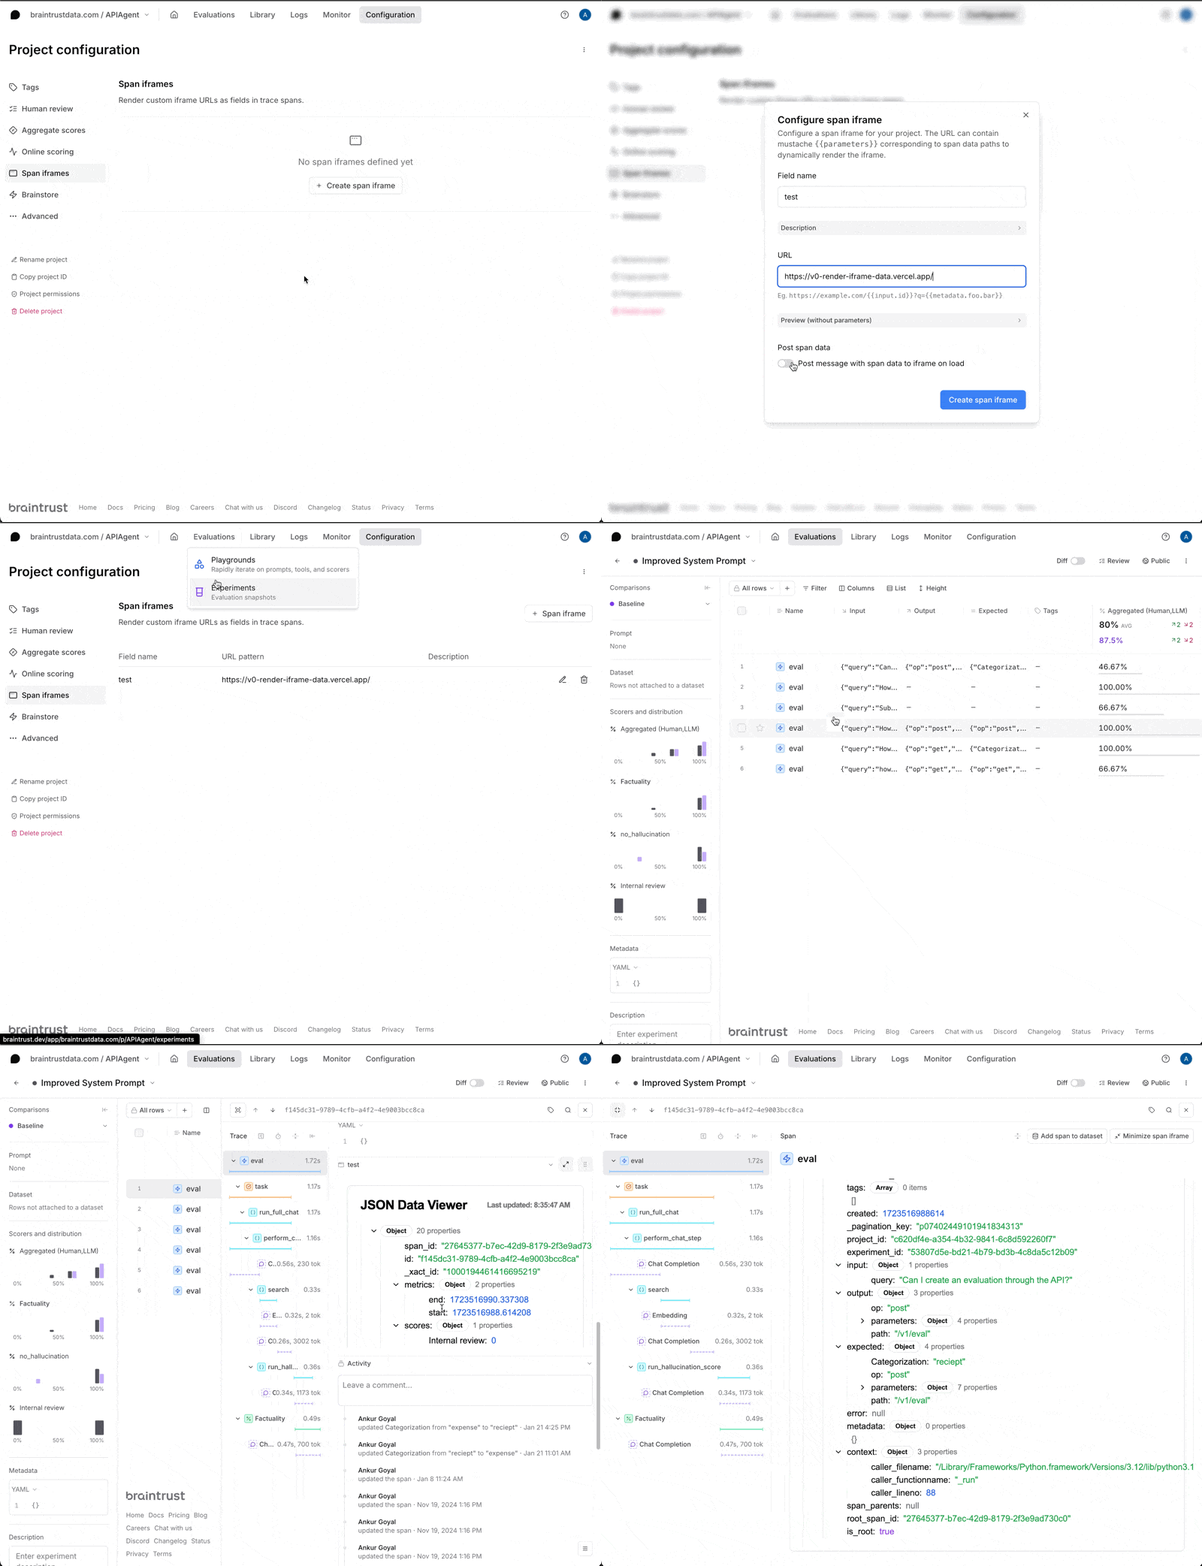
To enable a span iframe, visit the Configuration
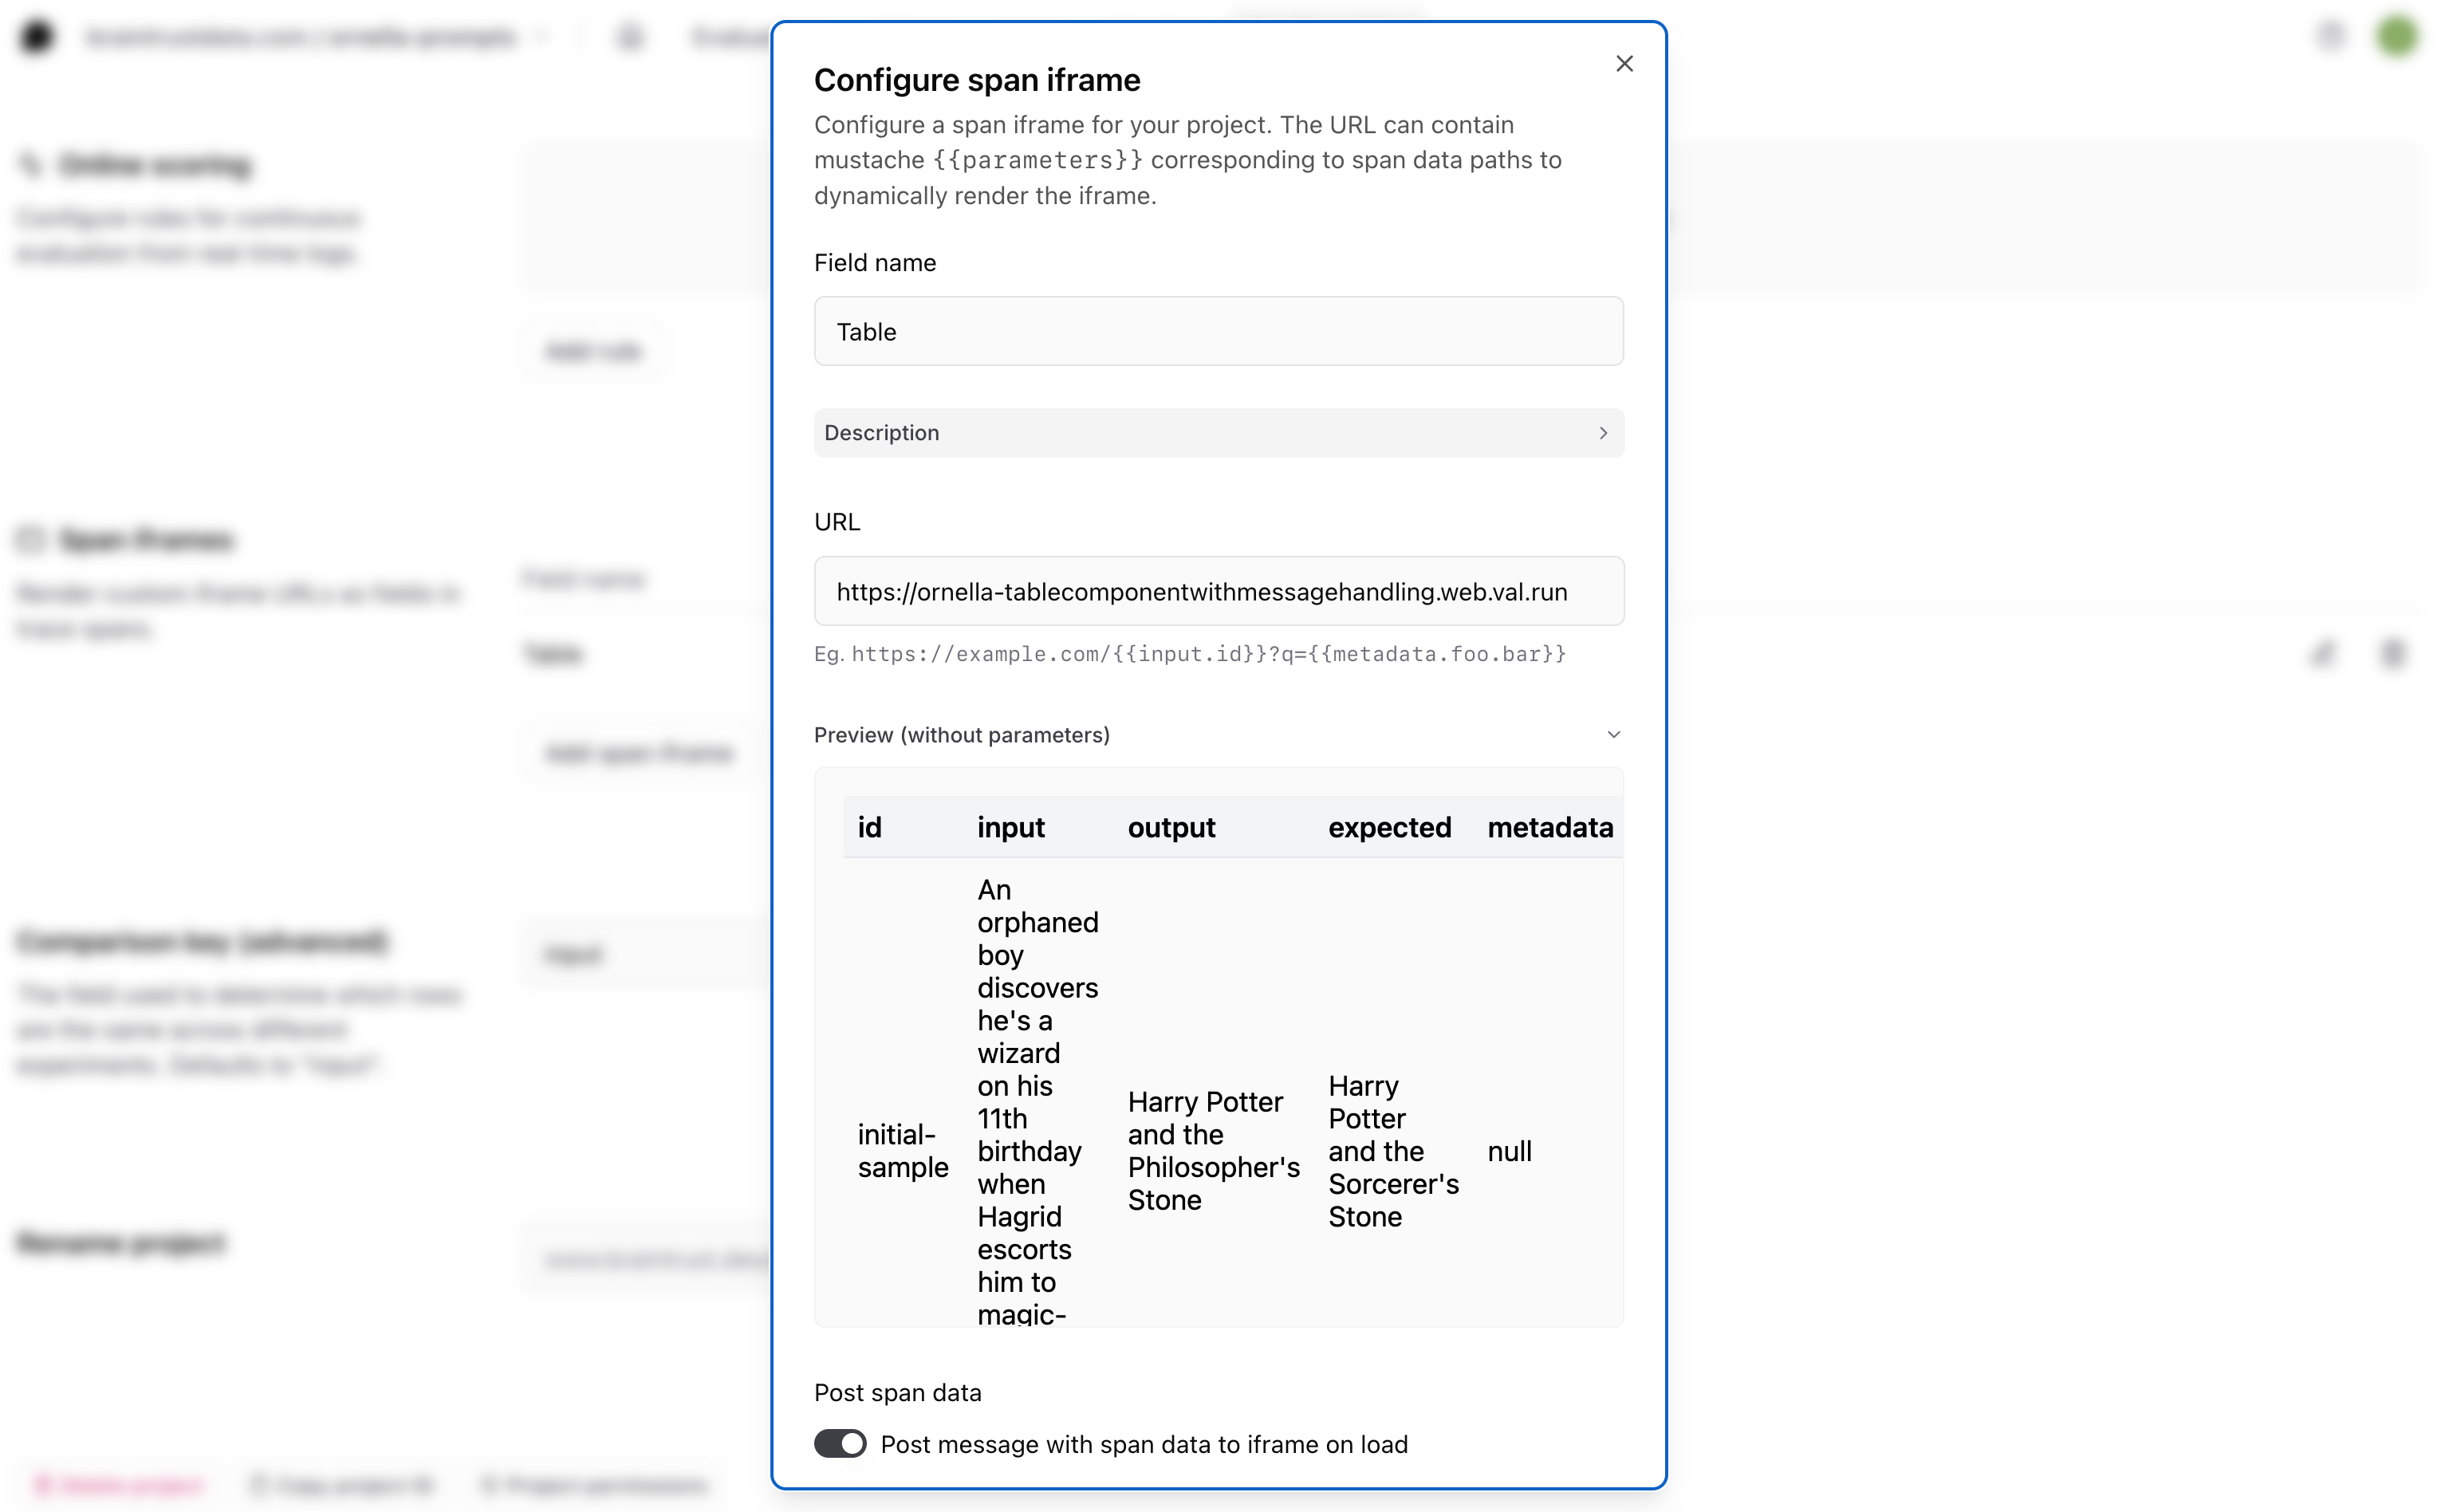
tab of a project, and create one. You can define the URL, and then customize its behavior:
- Provide a title, which is displayed at the top of the section.
- Provide, via mustache, template parameters to the URL. These parameters are
in terms of the top-level span fields, e.g.
{{input}},{{output}},{{expected}}, etc. or their subfields, e.g.{{input.question}}. - Allow Braintrust to send a message to the iframe with the span data, which is useful when the data may be very large and not fit in a URL.
- Send messages from the iframe back to Braintrust to update the span data.
Quickstart
Since span iframes run your custom code, you need to host them somewhere. Tools like val.town or v0.dev make it easy to do this. You can use https://v0-render-iframe-data.vercel.app/ as a quick test. It renders a JSON object which shows you all of the fields that are available in the span.
iframe message format
In Zod format, the message schema looks like this:{ "type": "request-data" } from your frame code.
Sample workflow
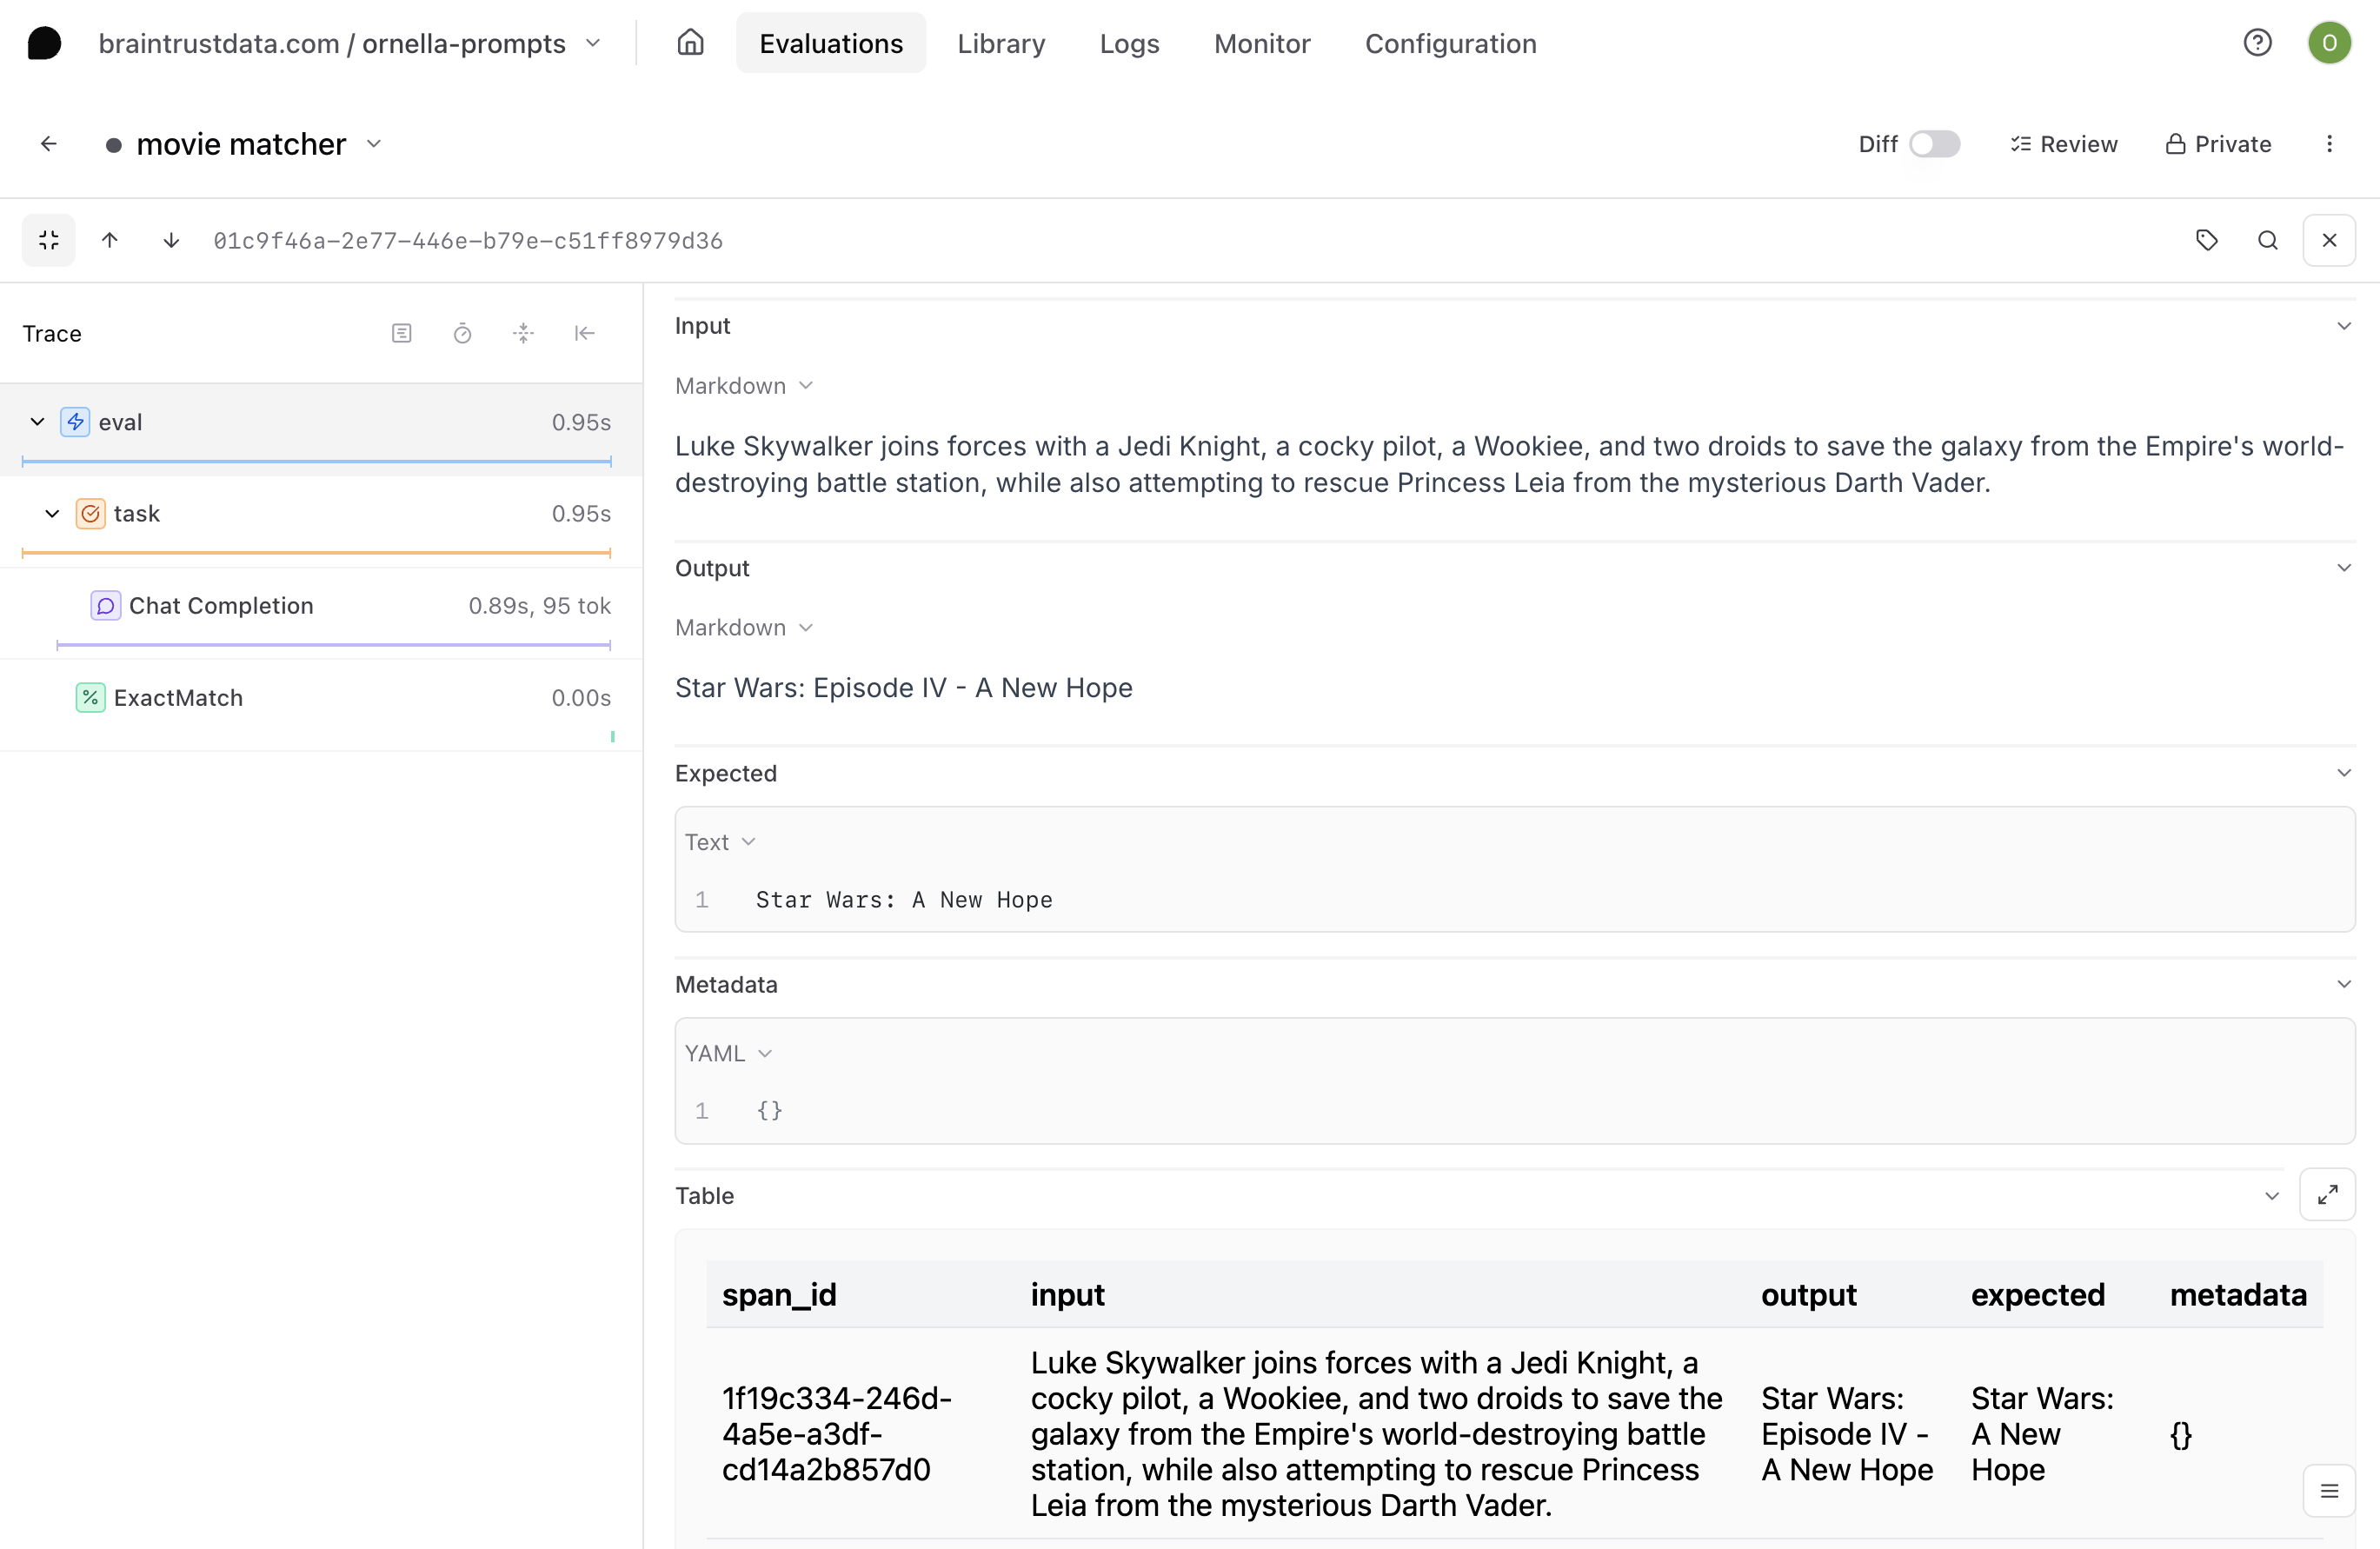
Say you want to render theinput, output, expected, and id fields for a given span in a table format for easier parsing.
The first thing you’ll need to do is choose where to host your table. Span iframes are externally hosted, either in your own infrastructure or a cloud hosting service. In this example, we’ll use Val Town. Navigate to val.town and create an account if you don’t already have one.
Next, you’ll need to write the code for the component you’d like to render inside of your span, making sure that it uses the correct message handling to allow communication with Braintrust. To speed things up, we can go to Townie, Val Town’s AI assistant that helps you get pages up and running quickly. Prompt the AI to generate your table code for you, keeping these few things in mind:
- You’ll want to add the message handling that allows the iframe to send messages back to Braintrust
To do this, we use the window.postMessage() method behind the scenes.
- You’ll want to use some hardcoded span data to illustrate what it might look like in the preview before you ship
Townie will generate some code for you and automatically deploy it to a URL. Check it out and make sure the table looks how you’d like, then copy the URL.

Example code
To help you get started, check out the braintrustdata/braintrust-viewers repository on Github, which contains example code for rendering a table, X/Tweet, and more.Tune performance
Configure SDK behavior with environment variables for your deployment needs:BRAINTRUST_SYNC_FLUSH: Set to1to flush synchronously instead of in background. Useful for debugging but impacts performance.BRAINTRUST_MAX_REQUEST_SIZE: Maximum batch payload size. Defaults are tuned for AWS Lambda.BRAINTRUST_DEFAULT_BATCH_SIZE: Maximum number of log messages per network request.BRAINTRUST_NUM_RETRIES: Network retry attempts before failing.BRAINTRUST_QUEUE_SIZE(Python): Maximum logging queue size. Additional logs drop oldest elements.BRAINTRUST_QUEUE_DROP_EXCEEDING_MAXSIZE(JavaScript): Cap queue size and discard additional elements.BRAINTRUST_FLUSH_BACKPRESSURE_BYTES(JavaScript): Byte threshold for flush backpressure during evaluations. WhenmaxConcurrencyis set, the SDK only flushes logs when pending data exceeds this threshold, avoiding excessive sequential round-trips for small payloads while bounding memory usage for large ones. Defaults to 10 MB.BRAINTRUST_DISABLE_ATEXIT_FLUSH(Python): Disables the automatic flush that Braintrust registers at process exit. When set to1, pending logs are not flushed on interpreter shutdown, so applications should calllogger.flush()explicitly. Useful for runtimes with custom shutdown handling. Disabled by default.
BRAINTRUST_FAILED_PUBLISH_PAYLOADS_DIR: Directory for failed payloadsBRAINTRUST_ALL_PUBLISH_PAYLOADS_DIR: Directory for all payloads
Next steps
- Capture user feedback on your traces
- Log attachments like images and audio
- View your logs in the Braintrust dashboard
