View results
To view the results of an experiment, go to Experiments in your project and select the experiment from the list.-
Traces vs. spans - By default, experiments display as a table of traces where each row represents a complete trace with its root span. To view the individual spans in traces instead, select Display > Row type > Spans.
View individual spans when you want to:
- Analyze specific operations within traces
- Find particular function calls or API requests
- Examine timing and token usage for individual operations
Spans view is optimized for analyzing individual operations. Experiment comparisons and diff mode are only available when viewing traces. - Metrics - Along with the scores you track, Braintrust tracks a number of metrics about your LLM calls that help you assess and understand performance. For example, if you’re trying to figure out why the average duration increased substantially when you change a model, it’s useful to look at both duration and token metrics to diagnose the underlying issue. To compute LLM metrics like token counts, make sure you wrap your LLM calls.
-
Experiment summary - Select Details to view:
- Comparisons to other experiments
- Scorers used in the evaluation
- Datasets tested
- Metadata like model and parameters
Filter results
Each project provides default table views with common filters for experiments, including:- Default view: Shows all traces in the experiment
- Non-errors: Shows only traces without errors
- Errors: Shows only traces with errors
- Scorer errors: Show only traces with scorer errors
- Unreviewed: Hides traces that have been human-reviewed
- Assigned to me: Shows only traces assigned to the current user for human review
metadata query parameter on GET /v1/experiment. See Filter experiments by metadata for details.
Group results
Select Display > Group by to group the table by metadata fields to see patterns. By default, group rows show one experiment’s summary data. To view summary data for all experiments, select Include comparisons in group.Order by regressions
Score and metric columns show summary statistics in their headers. To order columns by regressions, select Display > Columns > Order by regressions. Within grouped tables, this sorts rows by regressions of a specific score relative to a comparison experiment.Examine a trace
Select any row to open the trace view and see complete details:- Input, output, and expected values
- Metadata and parameters
- All spans in the trace hierarchy
- Scores and their explanations
- Timing and token usage
When comparing experiments with diff mode enabled, only the default trace view is available. Timeline, Thread, and custom views are disabled during comparison.
View as a hierarchy
While viewing a trace, select Trace to view the trace as a nested hierarchy. Each span is indented under its parent, making it useful for understanding the logical structure of your application: which function called which, how tool calls nest under LLM calls, and how sub-tasks relate to the root task. Expand and collapse branches to navigate the call graph. Each span row shows inline metrics. By default, these are duration, total tokens, and estimated LLM cost. Cost is propagated from child spans to parent spans, making it easy to see which parts of a multi-step workflow are consuming the most of your cost budget. Use > Display metric types to toggle which metrics appear:- Duration (on by default)
- Total tokens (on by default)
- Time to first token
- Estimated LLM cost (on by default)
View as a timeline
While viewing a trace, select Timeline to visualize the trace as a horizontal bar chart. Each bar represents a span, and bar width represents a metric of your choice. Bars are color-coded by span type, making it easy to identify performance bottlenecks and understand the execution flow. Select and then Scale by to change the metric used to scale the bars. Available options:- Duration (default) — bar width represents wall-clock time
- Total tokens — bar width represents total token usage, useful for identifying spans that consume the most context
- Prompt tokens — bar width represents input token usage
- Completion tokens — bar width represents output token usage
- Estimated cost — bar width represents the estimated cost of each span
- Enable Maintain hierarchy to preserve parent-child relationships: Parent spans are kept even if they don’t match the filter, as long as they have matching descendants.
View as a conversation
While viewing a trace, select Thread to view the trace as a conversation thread. This view displays messages, tool calls, and scores in chronological order, stripping away the hierarchy to show what was said and in what order. Use it for reading agent conversations and understanding the narrative flow of multi-turn interactions. By default, the thread view renders raw span data. Select to apply a preprocessor — choose the built-in Thread preprocessor to format the trace as a readable conversation, or select a custom preprocessor to control exactly how messages are rendered. When topics are enabled, topic tags and facet outputs appear at the top of the thread view as well. Use Find or pressCmd/Ctrl+F to search within the thread view and quickly locate specific content such as message text and score rationale. Matches are highlighted in-place using your browser’s native highlighting. This search is scoped to the thread view content — use the trace view’s search feature to search across spans.
Test and apply signals
While viewing a trace, select Signals to test topic facets and scorers on the current trace.- Topic facets: Test how preprocessors transform the trace data, test what summaries prompts extract, or apply the complete facet (preprocessor + prompt) to see the end-to-end result.
- Scorers: Test scorers, apply them to the trace, or configure an automation rule for online scoring.
Create custom trace views
While viewing a trace, select Views to create custom visualizations using natural language. Describe how you want to view your trace data and Loop will generate the code. For example:- “Create a view that renders a list of all tools available in this trace and their outputs”
- “Render the video url from the trace’s metadata field and show simple thumbs up/down buttons”
Self-hosted deployments: If you restrict outbound access, allowlist
https://www.braintrustsandbox.dev to enable custom views. This domain hosts the sandboxed iframe that securely renders custom view code.Search within a trace
While viewing a trace, use Find or pressCmd/Ctrl+F to search for content within the trace. A scope dropdown lets you choose where to search:
- This span — Search only within the currently selected span.
- Full trace — Search across all spans in the trace.
Trace search finds content within the currently open trace. To search across all traces in your project, use filters or deep search.
Change span data format
When viewing a trace, each span field (input, output, metadata, etc.) displays data in a specific format. Change how a field displays by selecting the view mode dropdown in the field’s header. Available views:- Pretty - Parses objects deeply and renders values as Markdown (optimized for readability)
- JSON - JSON highlighting and folding
- YAML - YAML highlighting and folding
- Tree - Hierarchical tree view for nested data structures
- LLM - Formatted AI messages and tool calls with Markdown
- LLM Raw - Unformatted AI messages and tool calls
- HTML - Rendered HTML content
View raw trace data
When viewing a trace, select a span and then select the button in the span’s header to view the complete JSON representation. The raw data view shows all fields including metadata, inputs, outputs, and internal properties that may not be visible in other views. The raw data view has two tabs:- This span - Shows the complete JSON for the selected span only
- Full trace - Shows the complete JSON for the entire trace
- Inspect the complete span structure for debugging
- Find specific fields in large or deeply nested spans
- Verify exact values and data types
- Export or copy the full span for reproduction
Assign for review
You can assign experiment rows to team members for review, analysis, or follow-up action. Assignments are particularly useful for human review workflows, where you can assign specific rows that need human evaluation and distribute review work across multiple team members. See Assign rows for review for details.Score retrospectively
Apply scorers to existing experiments:- Multiple cases: Select rows and use Score to apply chosen scorers
- Single case: Open a trace and use Score in the trace view
Analyze with Loop
Use Loop to analyze experiment results, identify patterns, and get improvement suggestions. Loop can help you understand why certain test cases succeeded or failed and generate actionable recommendations. Select one or more experiments and open Loop to:- Summarize results: Get high-level insights about experiment performance, score trends, and key differences between experiments.
- Drill into specific rows: Ask Loop to analyze test cases that performed poorly or identify patterns across failures.
- Generate improvements: Loop can suggest changes to prompts, scorers, or datasets based on experiment results.
- Create datasets: Extract problematic or interesting test cases into new datasets for targeted evaluation.
- Generate code: Get sample code for implementing improvements to test in your next experiment.
- “What improved from the last experiment?”
- “Categorize the errors in this experiment”
- “Pick the best scorers for this task”
- “Why did the factuality score drop?”
- “Create a dataset from the rows where the model failed”
- “What patterns do you see in the low-scoring cases?”
Use aggregate scores
Aggregate scores are formulas that combine multiple scores into a single metric. They are useful when you track many scores but need a single metric to represent overall experiment quality. See Create aggregate scores for more details.Download results
To download an experiment’s results, select and then Download as CSV or Download as JSON.Customize the experiments table
Adjust table layout
To switch between different layouts, select Display > Layout and one of the following:- List: Default table view
- Grid: Compare outputs side-by-side
- Summary: Large-type summary of scores and metrics across all experiments
Show and hide columns
Select Display > Columns and then:- Show or hide columns to focus on relevant data
- Reorder columns by dragging them
- Pin important columns to the left
Create custom columns
Extract specific values from traces using custom columns:- Select Display > Columns > + Add custom column.
- Name your column.
- Choose from inferred fields or write a SQL expression.
Create custom table views
To create or update a custom table view:- Apply the filters and display settings you want.
- Open the menu and select Save view… or Save view as….
Custom table views are visible to all project members. Creating or editing a table view requires the Update project permission.
Set default table views
You can set default views at two levels:- Organization default: Visible to all members when they open the page. This applies per page — for example, you can set separate organization defaults for Logs, Experiments, and Review. To set an organization default, you need the Manage settings organization permission (included by default in the Owner role). See Access control for details.
- Personal default: Overrides the organization default for you only. Personal defaults are stored in your browser, so they do not carry over across devices or browsers.
- Switch to the view you want by selecting it from the menu.
- Open the menu again and hover over the currently selected view to reveal its submenu.
- Choose Set as personal default view or Set as organization default view.
- Open the menu and hover over the currently selected view to reveal its submenu.
- Choose Clear personal default view or Clear organization default view.
Change the table density
To change the table density to see more or less detail per row, select Display > Row height > Compact or Tall.Export experiments
- UI
- SDK
- API
To export an experiment’s results, open the menu next to the experiment name. You can export as CSV or JSON, and choose whether to download all fields.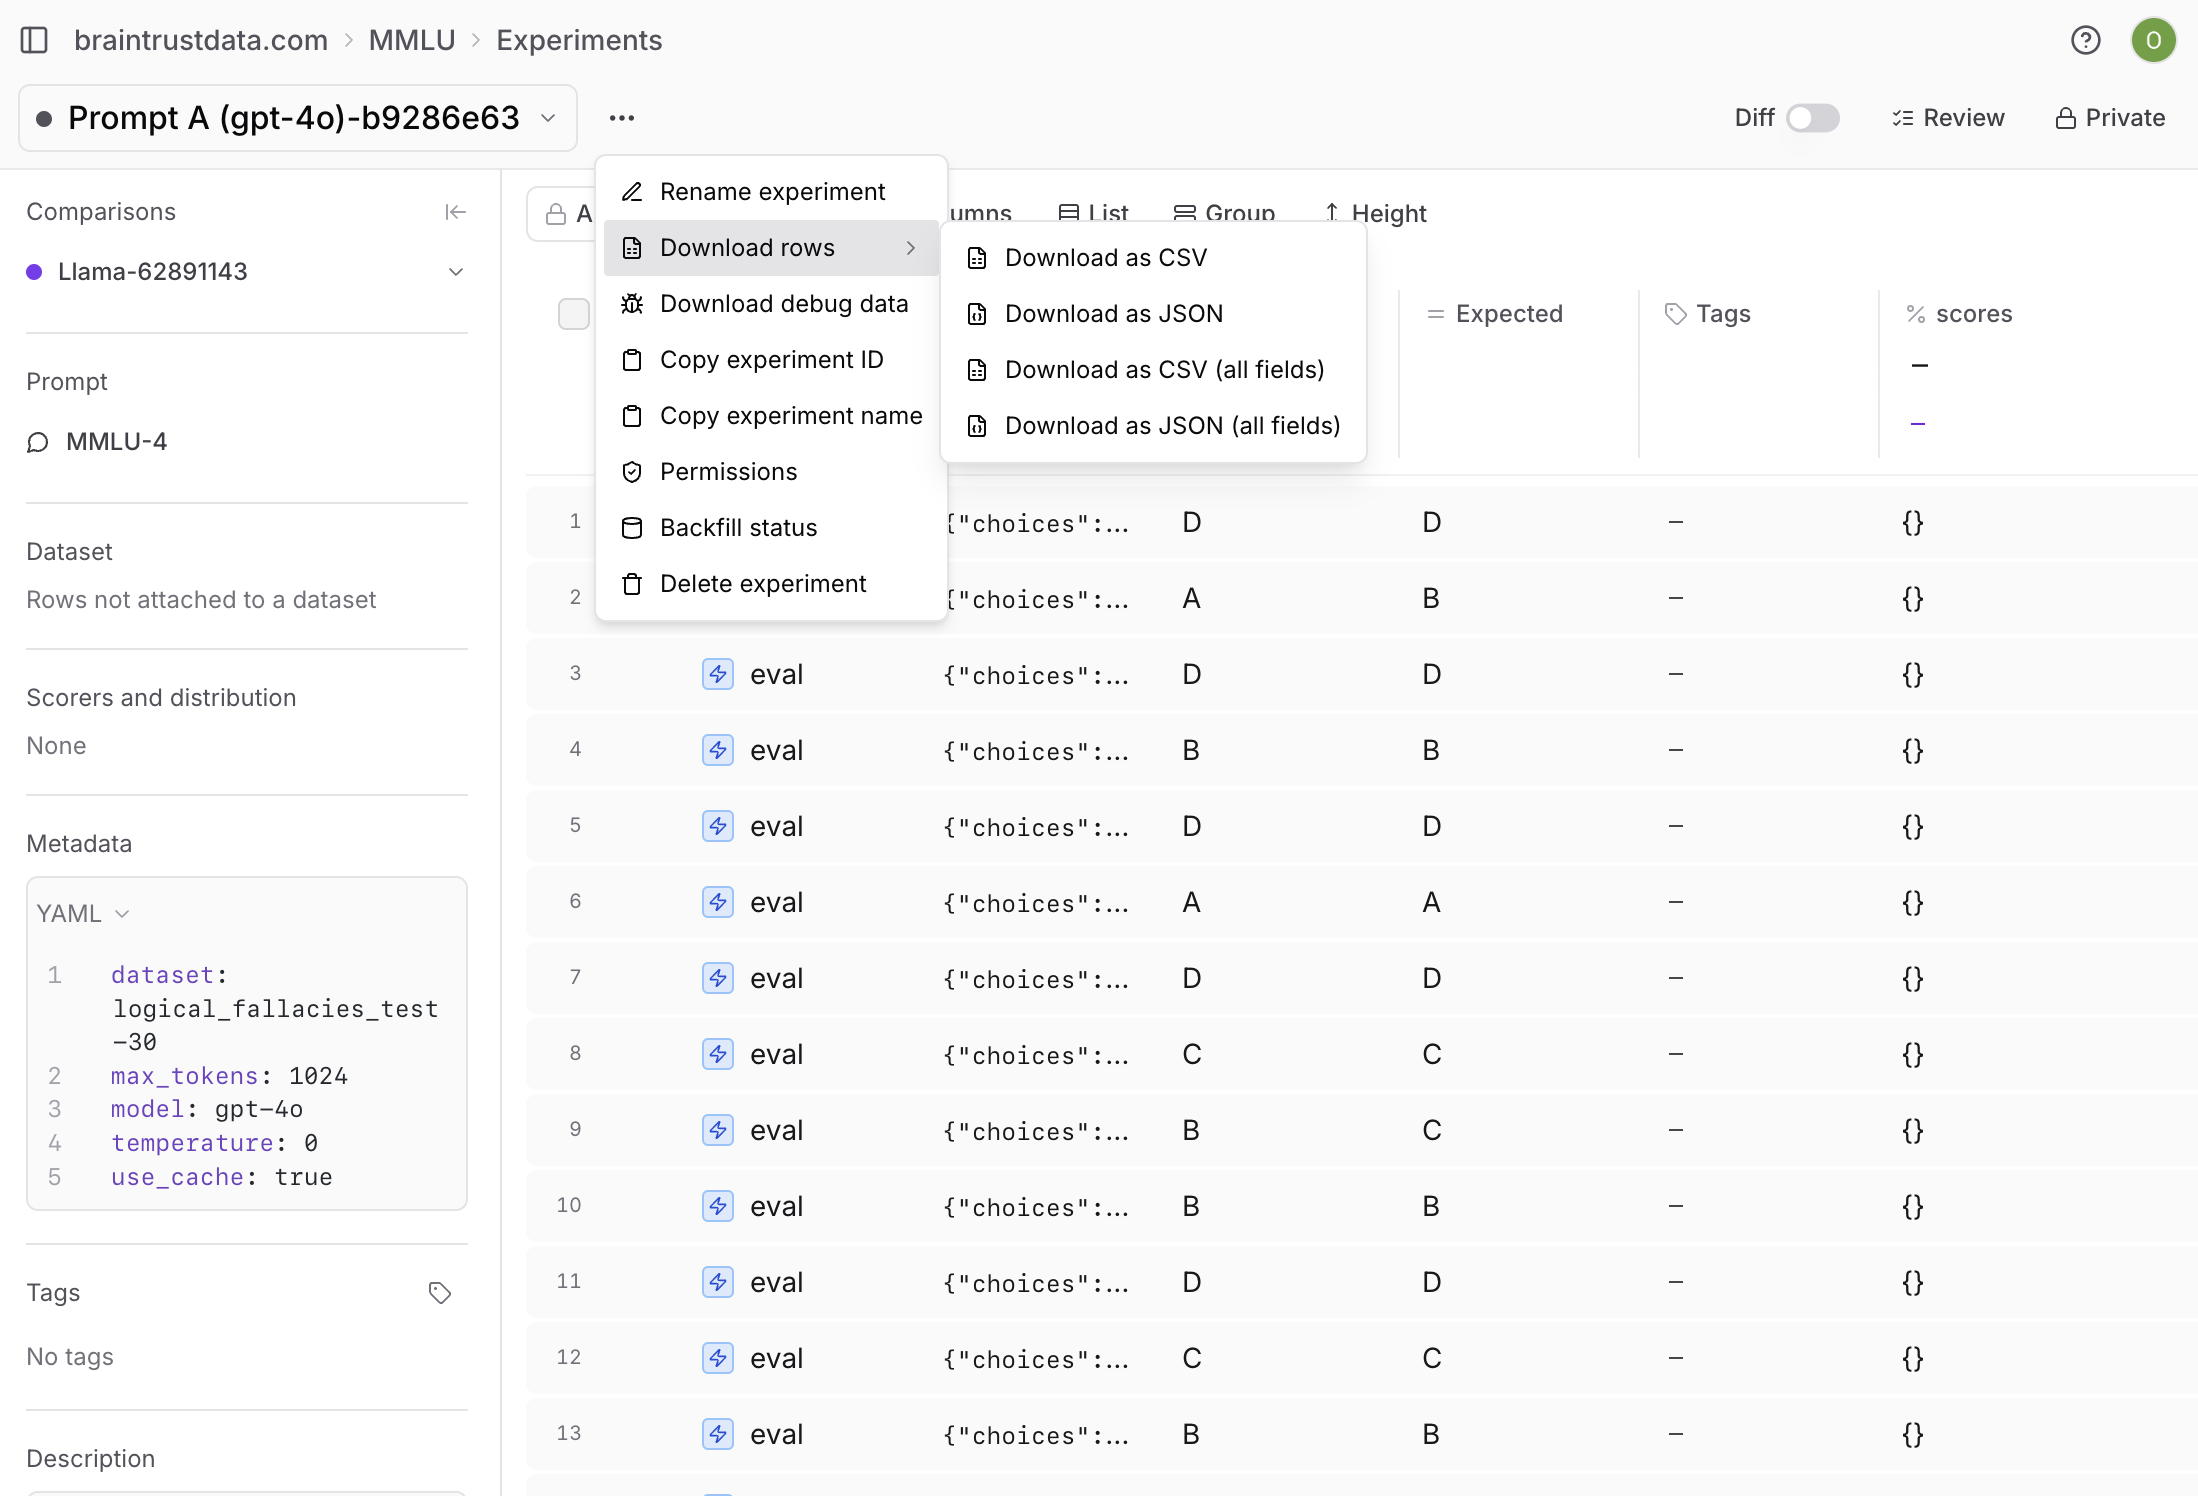
Next steps
- Compare experiments systematically
- Write scorers to measure what matters
- Use playgrounds for rapid iteration
- Run evaluations in CI/CD