Anatomy of a trace
A trace represents one end-to-end execution — a single request or interaction in logs, or a single test case run in experiments. Every trace contains one or more spans, each representing a unit of work with a start and end time. Spans nest inside each other to reflect your application’s execution flow. Braintrust assigns a type to each span:
Each span has an
id that identifies it individually, while the trace as a whole is identified by its root_span_id. To learn how these IDs work and which to use when querying or linking, see identify spans and traces.
Inspect a trace
Select the Trace tab to examine a trace’s execution. Switch between three layouts to view the whole trace:- Spans () — Read the trace as a nested call graph.
- Thread () — Follow the trace as a conversation, in order.
- Timeline () — See execution flow and token efficiency.
View as a hierarchy
In the Trace tab, select Spans () to view the trace as a nested hierarchy. Each span is indented under its parent, making it useful for understanding the logical structure of your application: which function called which, how tool calls nest under LLM calls, and how sub-tasks relate to the root task. Expand and collapse branches to navigate the call graph.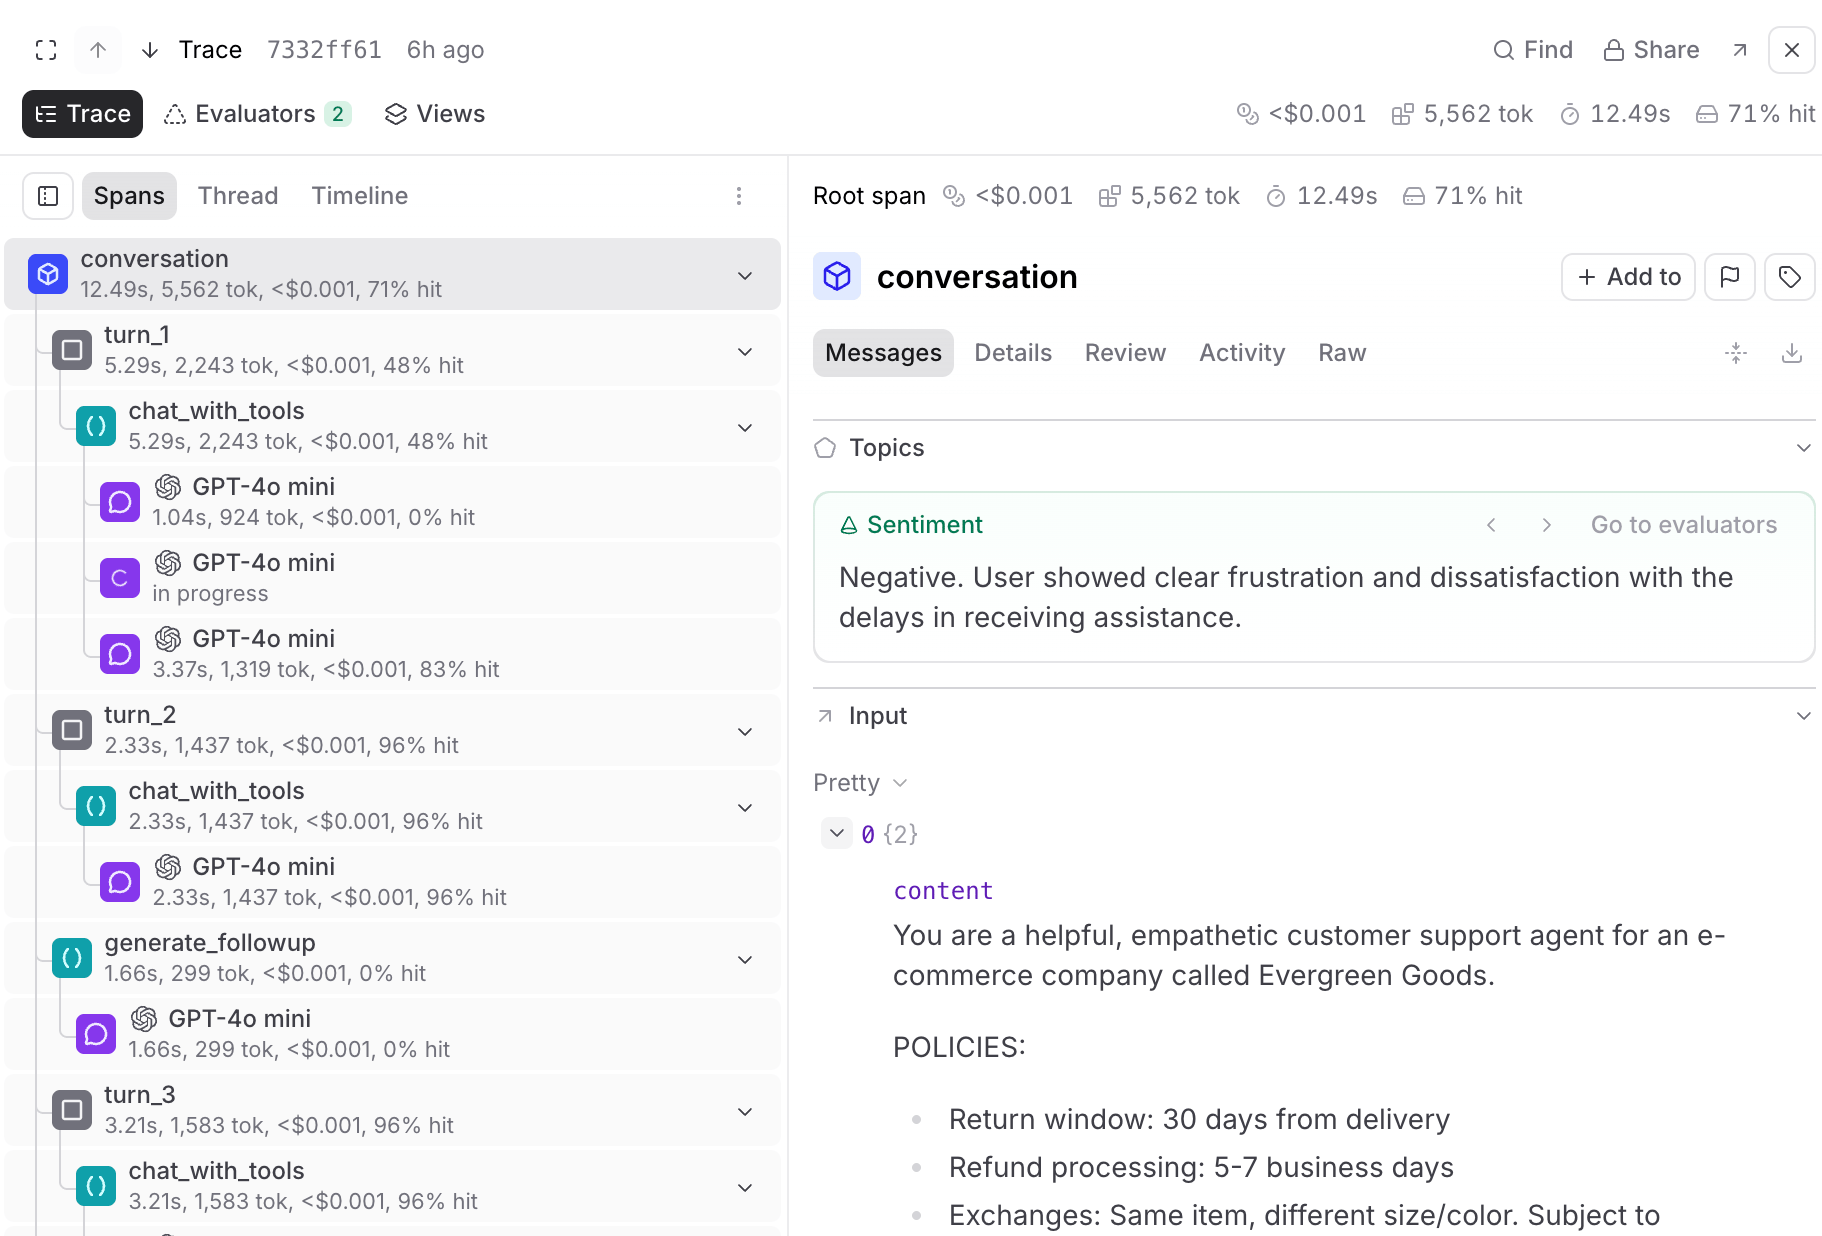
View span details
View span details
Select a span to open its detail panel, which groups the span’s data into tabs:
- Messages — Input and output messages, tool calls, and annotations. Span errors also appear here so they are visible alongside the input and output that produced them. When topics are enabled, topics and facet summaries appear at the top.
- Details — Metadata, metrics, parameters, and other non-message fields.
- Review — Expected output, human review scores, and the output-versus-expected comparison.
- Activity — The span’s version history and comments. See View activity history.
- Raw — The complete JSON representation of the span or trace. See View raw span data.
Display span metrics
Display span metrics
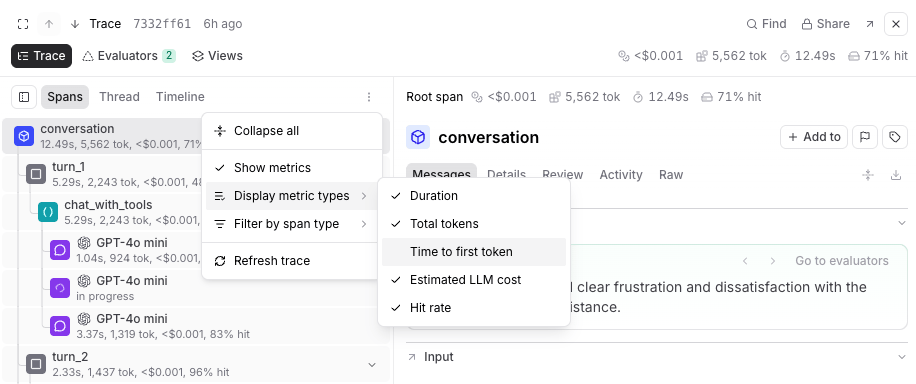
In the nested hierarchy, each span row shows inline metrics. By default, these are duration, total tokens, and estimated LLM cost. Cost is propagated from child spans to parent spans, making it easy to see which parts of a multi-step workflow are consuming the most of your cost budget. A parent span’s displayed cost is the sum of its child span costs plus any
metrics.estimated_cost logged on the parent itself. Use > Display metric types to toggle which metrics appear:- Duration (on by default)
- Total tokens (on by default)
- Time to first token
- Estimated LLM cost (on by default)
-
Hit rate (on by default)
View as a conversation
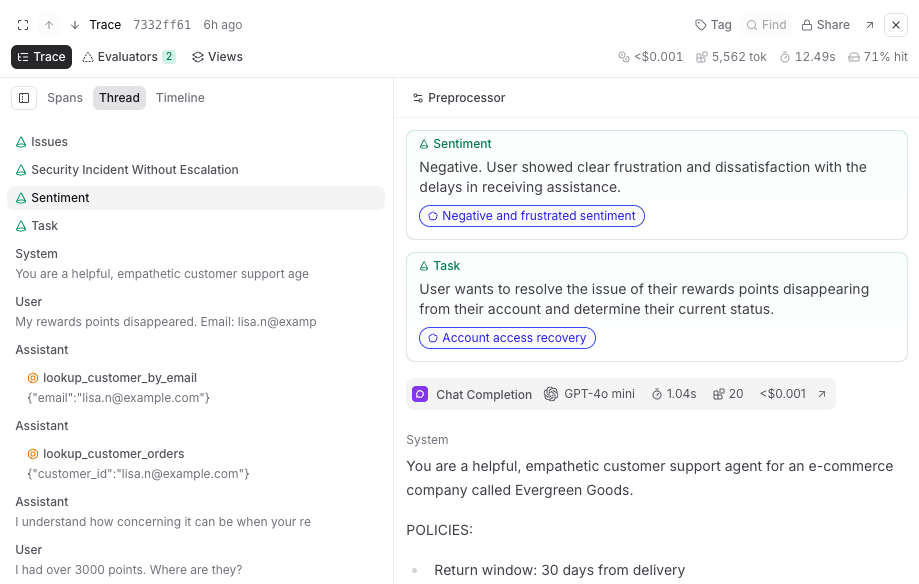
In the Trace tab, select Thread () to view the trace as a conversation thread. This layout displays messages, tool calls, and scores in chronological order, stripping away the hierarchy to show what was said and in what order. Use it for reading agent conversations and understanding the narrative flow of multi-turn interactions.- By default, the thread layout renders raw span data. Select to apply a preprocessor — choose the built-in Thread preprocessor to format the trace as a readable conversation, or select a custom preprocessor to control exactly how messages are rendered. When topics are enabled, topic tags and facet outputs appear at the top of the thread layout as well.
- To write a custom preprocessor, choose + Custom preprocessor in the picker, then click Copy prompt to pass coding-agent instructions for inspecting your real trace data and generating the function. See Write a custom preprocessor. If a preprocessor returns no messages, the thread layout shows an empty state with a Create custom preprocessor button.
- Use Find or press
Cmd/Ctrl+Fto search within the thread layout and quickly locate specific content such as message text and score rationale. Matches are highlighted in-place using your browser’s native highlighting. This search is scoped to the thread layout content — use the trace’s search feature to search across spans. - Select and choose Refresh to reload the thread data.
View as a timeline
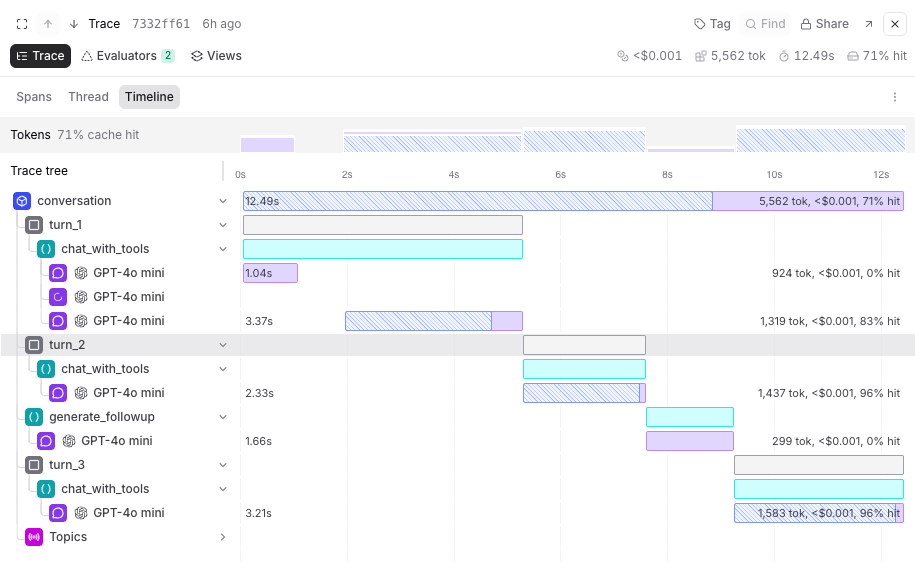
In the Trace tab, select Timeline () to understand execution flow and token efficiency:- Timeline bars — Each bar represents a span scaled by a metric of your choice and color-coded by span type.
- Token distribution overview — Breaks down LLM span token usage by type (uncached input, cached read, cache write, and output) and shows cache hit rate per span, making it easy to spot where caching is and isn’t working.
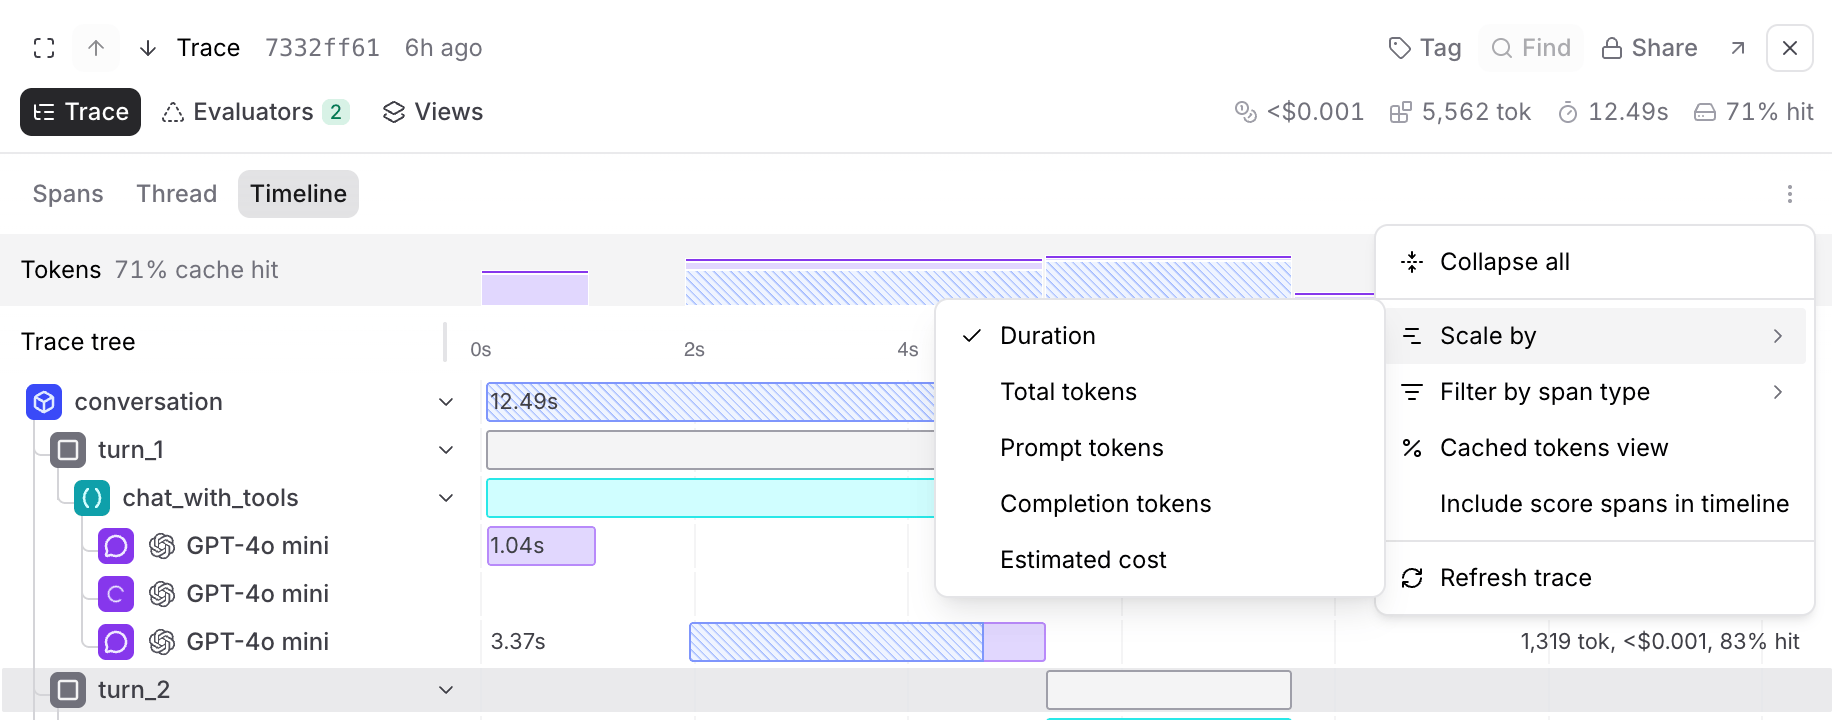
Scale timeline by metrics
Scale timeline by metrics
To change the metric used to scale the bars and token distribution overview, select and then Scale by. Available options:
- Duration (default) — Bar width represents wall-clock time
- Total tokens — Bar width represents total token usage, useful for identifying spans that consume the most context
- Prompt tokens — Bar width represents input token usage
- Completion tokens — Bar width represents output token usage
-
Estimated cost — Bar width represents the estimated cost of each span
Filter by span type
Filter by span type
To show only spans of specific types in the timeline and token distribution overview, select and then Filter by span type.
- Enable Maintain hierarchy to preserve parent-child relationships: Parent spans are kept even if they don’t match the filter, as long as they have matching descendants.
Assess prompt caching effectiveness
Assess prompt caching effectiveness
To assess prompt caching effectiveness at a glance, select and then Cached tokens view. This filters the timeline to LLM spans only, flattens the hierarchy, and scales each bar by cached read tokens with stacked segments for the input token breakdown (uncached input, cached read, and cache write). The Scale by and Filter by span type options and Maintain hierarchy are unavailable while it’s active.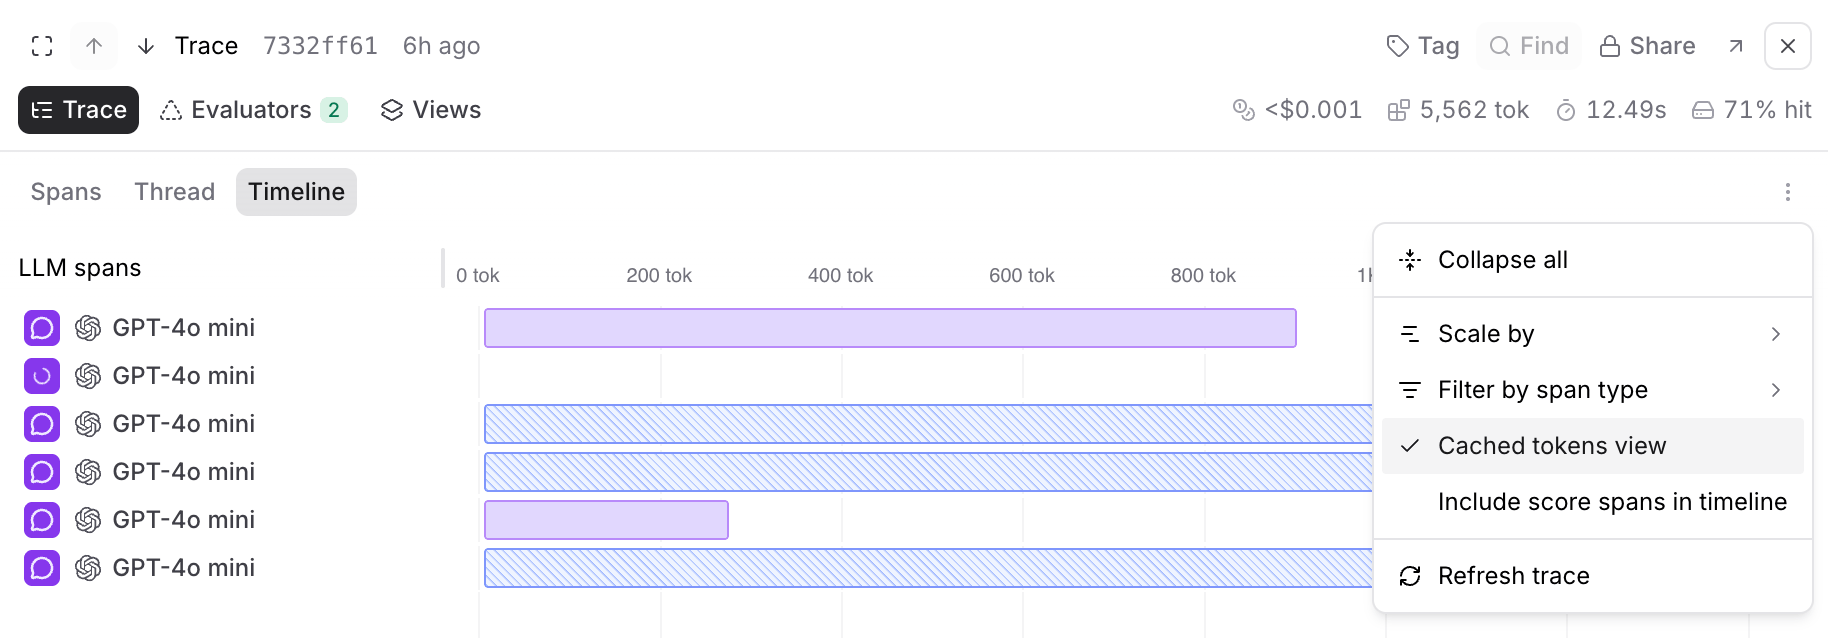
Post-hoc scoring spans
Post-hoc scoring spans
Post-hoc scoring spans (such as AutoEval results applied to logs) run after the root span completes and extend beyond the execution timeline. By default, the timeline hides these scorer spans to focus on the root execution duration. To display scorer spans inline, select and toggle Include score spans in timeline. This expands the timeline axis to fit the scoring duration, making it easy to see how long evaluations take to complete on each trace.
Change span data format
When viewing a trace, each span field (input, output, metadata, etc.) displays data in a specific format. Change how a field displays by selecting the view mode dropdown in the field’s header. Available views:- Pretty - Parses objects deeply and renders values as Markdown (optimized for readability)
- JSON - JSON highlighting and folding
- YAML - YAML highlighting and folding
- Tree - Hierarchical tree view for nested data structures
- LLM - Formatted AI messages and tool calls with Markdown
- LLM Raw - Unformatted AI messages and tool calls
- HTML - Rendered HTML content
View activity history
In the Trace tab, select the Spans () layout, select a span, and then select Activity in the span section tabs to see the row’s change history over time. This includes a chronological record of edits and merges, along with any comments left on the row. Activity history is stored with each row and is available on all plans.Activity history is scoped to a single row and is separate from organization audit logging, an Enterprise feature that records administrative actions across your organization, such as permission changes, member management, and API key creation.
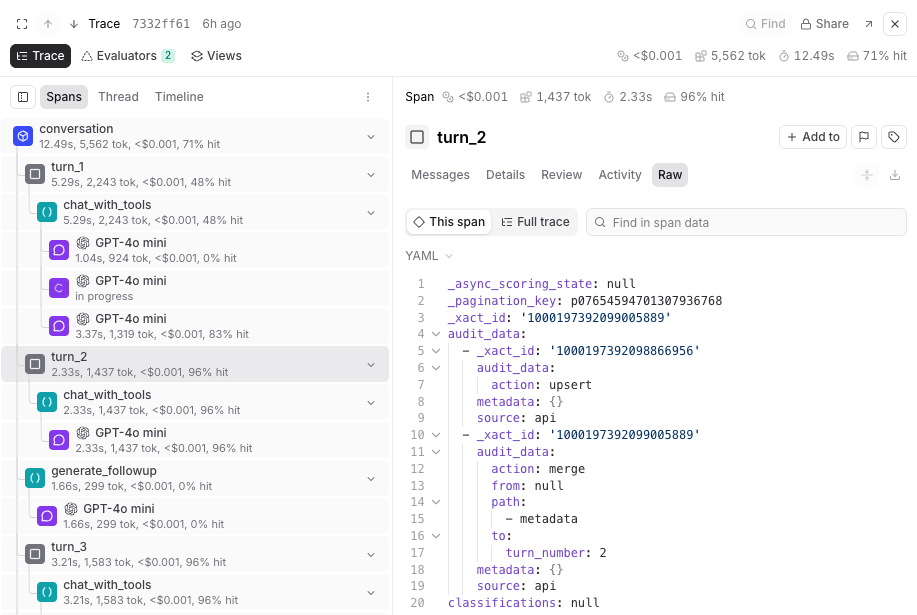
View raw span data
In the Trace tab, select the Spans () layout, select a span, and then select Raw in the span section tabs to view the complete JSON representation. The raw data view shows all fields including metadata, inputs, outputs, and internal properties that may not be visible in other views. The raw data view has two options:- This span - Shows the complete JSON for the selected span only
- Full trace - Shows the complete JSON for the entire trace
- Inspect the complete span structure for debugging
- Find specific fields in large or deeply nested spans
- Verify exact values and data types
- Export or copy the full span for reproduction
Search within a trace
While viewing a trace, use Find or pressCmd/Ctrl+F to search for content within the trace. A scope dropdown lets you choose where to search:
- This span — Search only within the currently selected span. Defaults to substring matching.
- Full trace — Search across all spans in the trace. Defaults to whole-word matching, which is faster than substring matching on large traces.
error doesn’t match terror or errors. It also treats punctuation-delimited terms as equivalent, so gpt-4, gpt_4, and gpt 4 all match the same content. Switching scopes resets the mode to that scope’s default unless you have explicitly set a mode.
Matching spans are highlighted in the trace tree so you can quickly navigate to relevant content. Clicking a result opens the matched span and switches the span detail panel to the tab containing the matched field.
Use the previous () and next () buttons, the Up and Down arrow keys, Enter, or Cmd/Ctrl+G to step through matches one occurrence at a time. In Full trace mode, navigation moves across span and field boundaries. When a field contains more than one match, the results panel shows the match count next to that field.
Trace search finds content within the currently open trace. To search across all traces in your project, use filters.
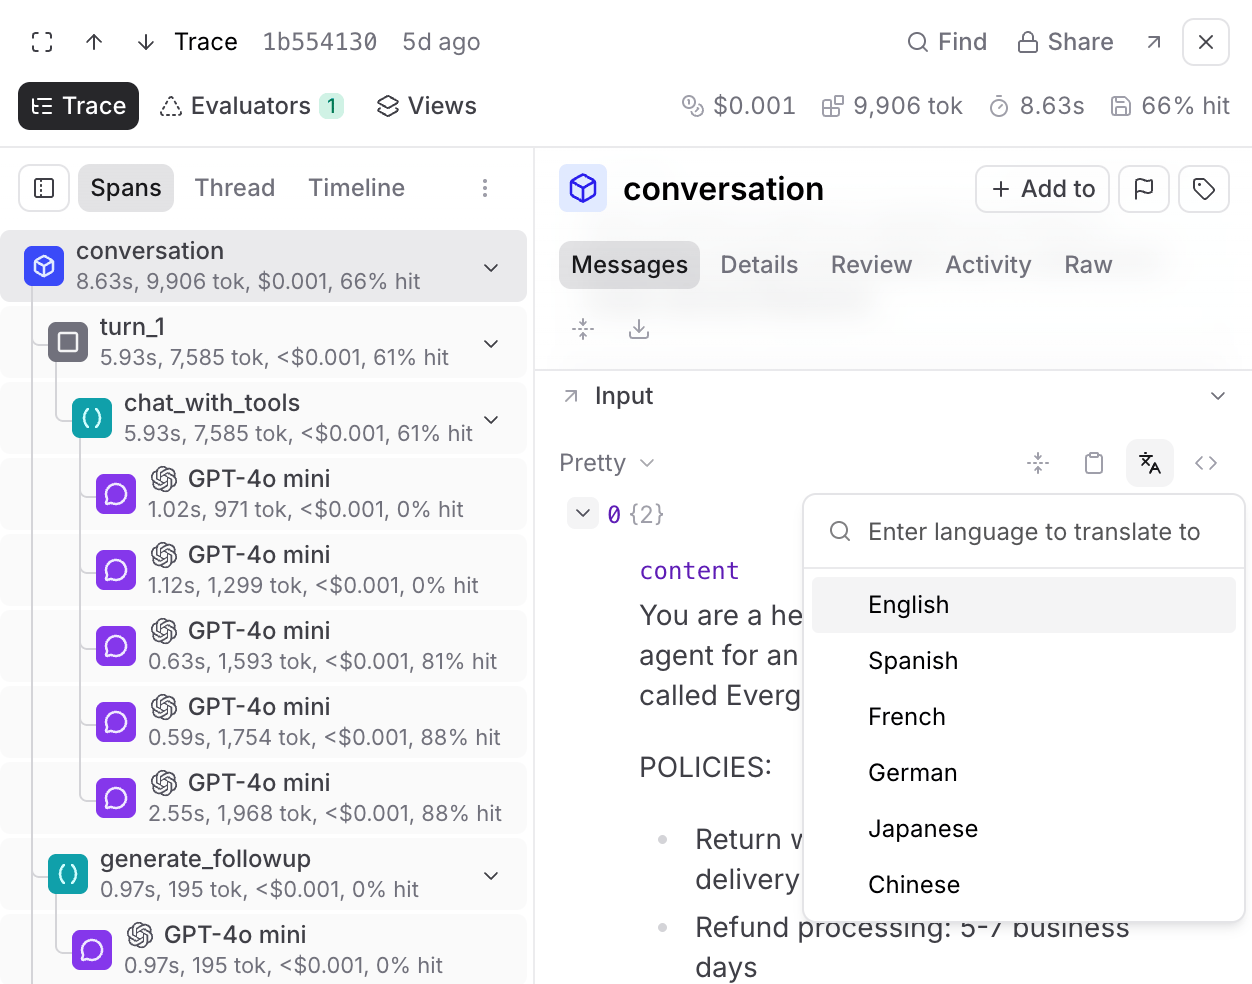
Translate message content
Select on a message bubble in the Thread () layout, or open the context menu on any string field in the Spans () layout, and pick a target language. Choose from English, Spanish, French, German, Japanese, and Chinese, or type any language name. The translated text appears inline beneath the message, with markdown and code formatting preserved. Translations are not saved to the span. They appear inline for the current session only.Translation uses the model currently selected in the Loop chat picker. If no AI provider is configured, it falls back to a Braintrust-served built-in model. With built-in models also disabled, translation can’t run.
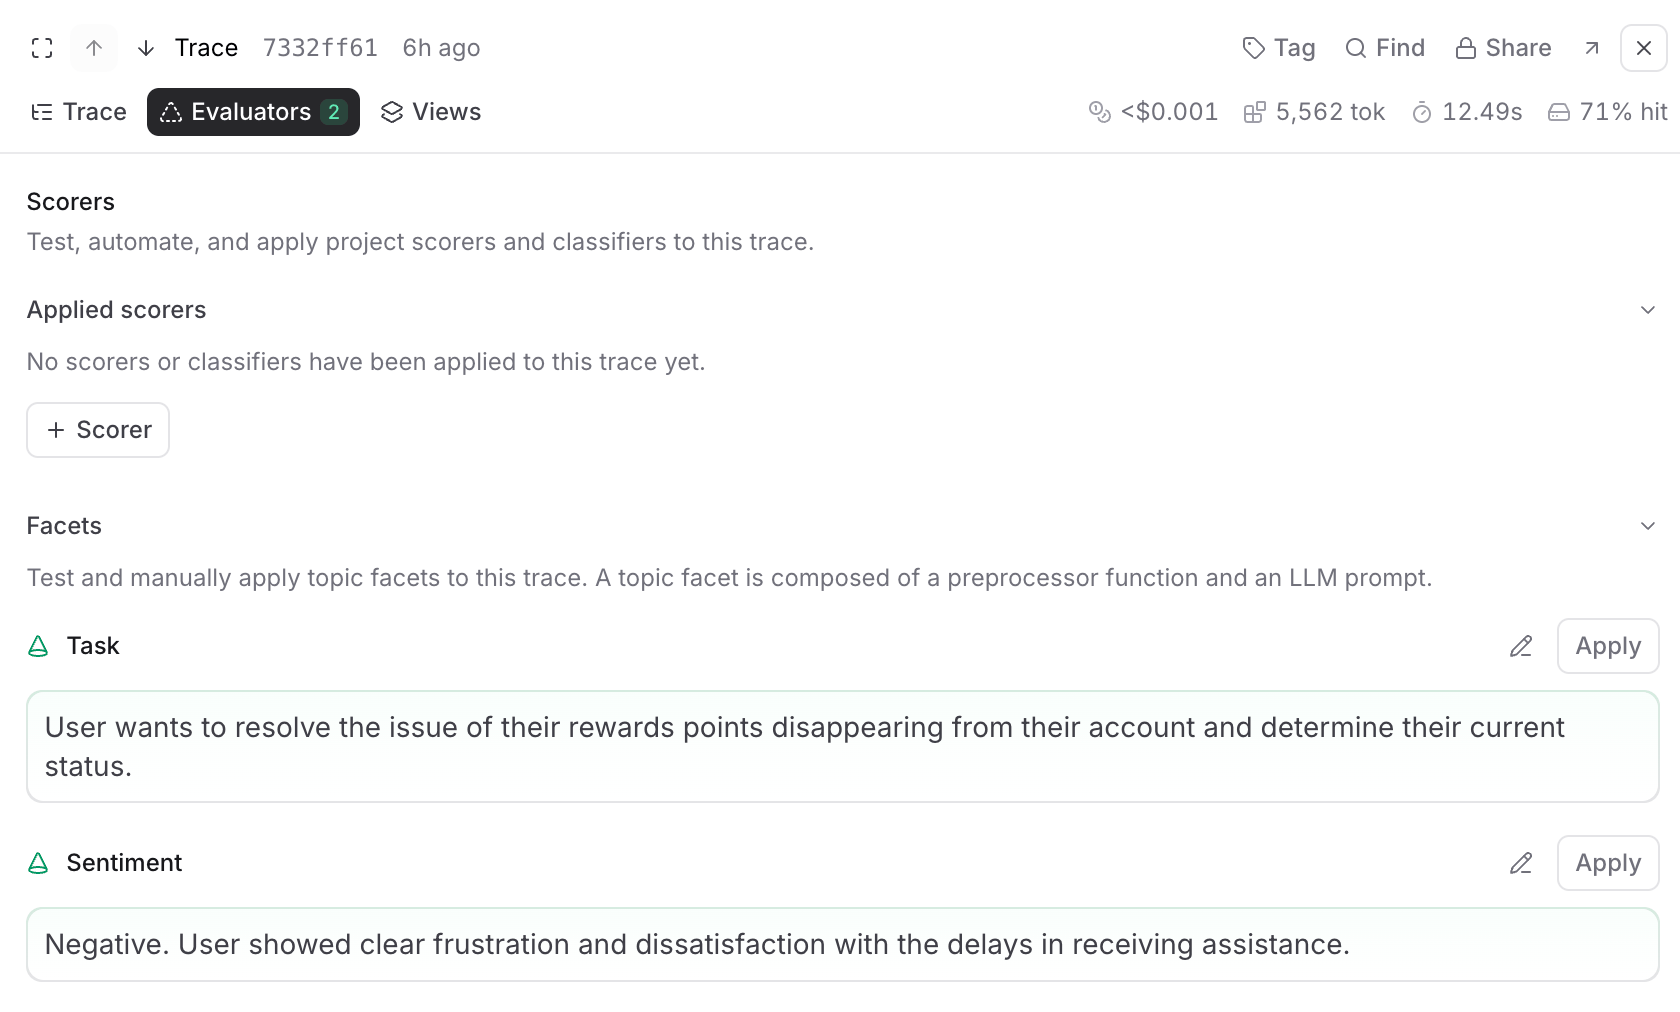
Test and apply evaluators
While viewing a trace, select Evaluators to test topic facets and scorers on the current trace.- Topic facets: Test how preprocessors transform the trace data, test what summaries prompts extract, or apply the complete facet (preprocessor + prompt) to see the end-to-end result.
- Scorers: Test scorers, apply them to the trace, or configure an automation rule for online scoring.
Create custom trace views
While viewing a trace, select Views to create custom visualizations using natural language. Describe how you want to view your trace data and Loop will generate the code. For example:- “Create a view that renders a list of all tools available in this trace and their outputs”
- “Render the video url from the trace’s metadata field and show simple thumbs up/down buttons”
Self-hosted deployments: If you restrict outbound access, allowlist
https://www.braintrustsandbox.dev to enable custom views. This domain hosts the sandboxed iframe that securely renders custom view code.Trace actions
Share, link to, and re-run content from a trace, or jump to where it came from. These options are available from the trace header or span context menus, regardless of the selected tab.Share a trace
When viewing a trace:- Select Share.
- Choose whether to make the trace Private or Public. Making a trace public grants access only to that trace.
- Click Copy link and share it with others.
Link to a trace or span
Every trace and span has a stable URL you can share or generate programmatically.-
Trace: open the logs route with
r=set to the trace’sroot_span_id:Ther=parameter is always theroot_span_id, not a span’sid. See Identify spans and traces. -
Single span or event: use the object permalink with the span’s
id: -
From the SDK: call
Span.permalink()to generate a span link without building the URL by hand.
tvt and tv parameters. See Open trace URLs in a specific view mode. To build event permalinks from the API without the SDK, see Creating permalinks to log events via API.
Navigate to trace origins
To trace the origin of a trace that comes from a prompt or dataset:- Click in the trace header.
- Choose Go to origin prompt or Go to origin dataset.
- Trace issues back to the original prompt or dataset
- See which dataset example led to a result
- Move efficiently between trace analysis and refining prompts or datasets
Re-run a prompt
When viewing a prompt span in a trace:- Select Run.
- In the Run prompt dialog, make changes as necessary.
- Select Test to see the output.
Next steps
- Score online to apply automated scoring to production traces
- Add to a dataset to curate interesting traces into ground truth
- Filter and search to find specific traces across logs
- Create dashboards to monitor metrics at scale
- Analyze with Loop to query across traces with natural language